
Every trader encounters a moment when the market moves against the prevailing trend, often affecting retracement stocks. The question is: is it a minor pause or the start of something bigger? This is where retracements come into play. Recognizing a retracement versus a true reversal can be the difference between locking in profits and getting caught in a losing trade. In this article, we’ll break down retracements in detail—what they are, how they differ from reversals and pullbacks, the tools to spot them, and how to trade them successfully across different asset classes.
What Is a Retracement?
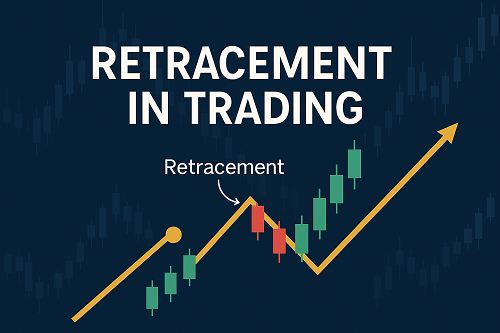
A retracement is a temporary reversal in the direction of a stock, forex pair, or crypto asset that goes against the prevailing trend, only to later resume in the original direction. It represents a short-term pause or correction rather than a full-blown trend change.
Key Characteristics:
- Happens within a longer-term trend
- Often caused by profit-taking or short-term sentiment shifts
- Typically supported by lower volume than reversals
For example, in an uptrend, a retracement appears as a short-lived dip before the price resumes its climb.
Retracement vs. Pullback vs. Reversal
| Feature | Retracement | Pullback | Reversal |
|---|---|---|---|
| Direction | Against trend | Against trend | Trend change |
| Duration | Short-term | Short- to medium-term | Long-term |
| Volume | Lower | Moderate | Higher |
| Signal | Continuation | Continuation | New trend |
| Trading Goal | Entry point | Entry point | Exit or reversal trade |
Understanding these distinctions is crucial for making informed trading decisions.
Common Indicators & Tools for Retracement Analysis
1. Fibonacci Retracement Levels
- Key ratios: 23.6%, 38.2%, 50%, 61.8%
- Useful for identifying potential bounce zones
2. Moving Averages
- 50-day and 200-day MAs serve as dynamic support/resistance
- Retracements often bounce off these lines
3. Oscillators (RSI, MACD)
- Spot divergences or oversold/overbought signals
- Confirm whether a retracement may be ending
4. Volume Analysis
- A retracement often occurs on lower volume compared to a reversal
How to Trade Retracements – Step-by-Step Strategy
Identify the Trend
Use moving averages or trendlines to confirm the dominant direction.
Mark Potential Retracement Zones
Apply Fibonacci tools from swing low to high or vice versa.
Wait for Confirmation
- Look for price action patterns (pin bars, engulfing candles)
- Confirm with oscillators and volume
Place Entry & Stops
- Enter at support (in uptrend) or resistance (in downtrend)
- Place stop-loss below/above last swing point
Set Profit Targets
Use Fibonacci extensions or previous highs/lows as targets
Real-World Trading Examples
Forex: EUR/USD
A retracement to the 50% Fibonacci level with RSI convergence can offer a solid long entry in an uptrend.
Stocks: AAPL
During a bullish run, AAPL retraces to its 50-day MA, presenting a textbook entry opportunity.
Crypto: BTC/USD
BTC pulls back 38.2% during a bull run—with low volume and MACD support—ideal for long re-entry.
Mistakes to Avoid When Trading Retracements
- Trading without trend confirmation
- Relying solely on one tool or indicator
- Ignoring volume and macroeconomic context
- Overtrading minor pullbacks as trend reversals
Expert Tips & Best Practices
- Use confluence of tools (e.g., Fibo + MA + RSI)
- Align with multiple timeframes
- Use dynamic stop-loss strategies
- Log every retracement trade for learning
FAQs About Retracements
Q: What percentage defines a retracement?
A: Common retracements occur between 38.2% and 61.8% based on Fibonacci levels.
Q: How do I know if it’s a retracement or a reversal?
A: Watch volume, trendline breaks, and higher timeframes. Reversals are typically stronger, with more confirmation.
Q: Do retracements work in crypto markets?
A: Yes. Despite volatility, crypto still respects Fibonacci and trend-based tools.
Mastering retracement stocks allows traders to enter trending markets with better timing and reduced risk. By combining technical tools, volume analysis, and practical experience, you can turn these temporary setbacks into powerful entry opportunities.
Next Step: Practice these strategies on demo accounts or live charts and download our free Fibonacci cheat sheet to get started.

 XAUT-USD
 AMD
AMD JNJ
JNJ MARA
MARA SHOP
SHOP UNH
UNH BULL
BULL EURUSD=X
 CL=F
CL=F