Understanding Dow Jones Stock Markets Futures
Dow Jones Stock Markets Futures are contracts that allow traders to speculate on, or hedge against, the future value of the Dow Jones Industrial Average (DJIA) — a benchmark index of 30 major U.S. companies.
The most actively traded version is the E-Mini Dow ($5) Futures Contract (symbol: YM), which trades on the Chicago Board of Trade (CBOT), part of the CME Group.
With each contract representing $5 per index point, these futures give traders powerful, cost-efficient exposure to the U.S. stock market. Whether you’re a professional hedge fund manager or an active retail trader, Dow Jones stock markets futures can be a vital tool in your trading arsenal.
What Are Dow Jones Stock Markets Futures?
Dow Jones stock markets futures are standardized agreements to buy or sell the DJIA at a predetermined price and date.
They are cash-settled, meaning there’s no physical delivery — instead, profits or losses are credited to your account daily.
Key Features of E-Mini Dow ($5) Futures:
- Ticker Symbols: YM (front month), YMW00 (continuous contract)
- Contract Size: $5 × Dow Jones Industrial Average
- Minimum Tick: 1 point = $5
- Contract Months: March, June, September, December
- Settlement: Cash
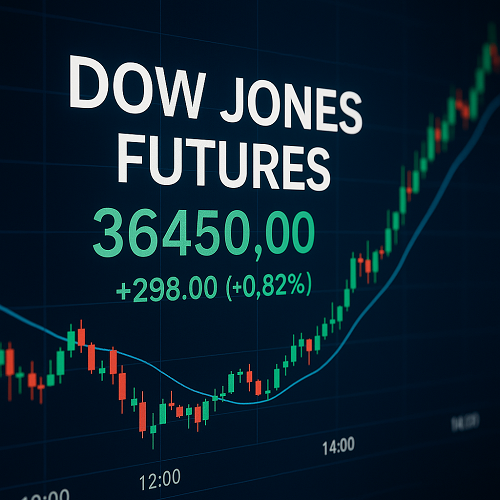
Live Price Snapshot — August 2025
As of August 8, 2025:
- Last Price: 44,349
- Previous Close: 44,080
- Day Range: 44,310 – 44,350
- 52-Week Range: ~38,890 – 44,600
Key Futures Expiries:
- Sep 2025: ~44,345
- Dec 2025: ~44,300
- Mar 2026: ~44,250
Live updates for Dow Jones stock markets futures can be tracked through CME Group or your brokerage platform.
Why Trade Dow Jones Stock Markets Futures?
Liquidity & Tight Spreads
High trading volume means minimal slippage for both day traders and institutional players.
Capital Efficiency
Lower margin requirements versus outright stock purchases enable efficient leverage.
Hedging Capabilities
Protect a Dow-heavy stock portfolio from market downturns without liquidating holdings.
Round-the-Clock Access
Trade almost 24 hours a day from Sunday evening to Friday afternoon (Central Time).
Key Trading Strategies for Dow Jones Stock Markets Futures
a) Intraday Momentum
Scalping quick intraday moves using indicators like VWAP and MACD.
b) Swing Trading
Capturing multi-day market trends driven by earnings or macroeconomic releases.
c) Spread Trading
Pairing Dow futures against S&P 500 or Nasdaq futures to trade index performance differentials.
d) Hedging
Neutralizing portfolio risk ahead of major news events or earnings seasons.
Factors That Move Dow Jones Stock Markets Futures
- Economic Reports (CPI, GDP, jobs data)
- Federal Reserve Policy changes
- Corporate Earnings from DJIA components
- Geopolitical Developments impacting investor sentiment
- Bond Market Movements influencing equity risk appetite
Advanced Trader Insights
Seasonality Trends
- November–April: Historically strong period (“winter rally”).
- May–August: Choppier trading with lower average returns.
- Pre-Election Years: Typically bullish for U.S. equities.
Volatility Cycles
- Fed Weeks: Daily ranges can expand by 20–30%.
- Earnings Season: Higher intraday swings.
- Crisis Events: Spikes in implied volatility — high risk, high reward.
Advanced Strategies for Dow Jones Stock Markets Futures
Opening Range Breakout
Trade breakouts from the first 30 minutes after the U.S. open.
Intermarket Analysis
Use S&P 500 and Nasdaq futures for confirmation signals.
Fed Day Fade
Fade extreme moves post-FOMC announcement when momentum cools.
Dow/S&P Spread
Go long YM / short ES when industrials outperform, and vice versa.
Risk Management for Dow Jones Stock Markets Futures
- Position Sizing: Limit risk to 0.5–1% of account equity per trade.
- Stop-Loss Orders: Essential to avoid large drawdowns.
- Margin Awareness: Maintain a buffer to prevent forced liquidation during volatility.
Example:
A trader with a $50,000 account risking 1% ($500) with a 50-point stop ($250 per contract) can trade 2 contracts.
Dow Jones stock markets futures provide direct, flexible, and cost-effective exposure to one of the world’s most followed equity benchmarks.
Whether used for short-term trading, long-term hedging, or index spread strategies, they remain a key instrument for traders who want to navigate U.S. equity market movements with precision.
Advanced Trader Insights for E-Mini Dow ($5) Futures
Historical Seasonality Trends
E-Mini Dow futures exhibit certain recurring seasonal patterns that experienced traders often use to refine entries and exits.
Key Observations (Past 15 Years):
- November–April Strength: The “winter rally” effect — fueled by year-end fund inflows, strong Q4 earnings, and favorable investor sentiment — has historically produced above-average returns.
- Sell in May & Summer Lull: The May–August period tends to be choppier with lower average gains and more frequent pullbacks.
- Pre-Election Years: Historically stronger for U.S. equities as fiscal and monetary policy often aim to support economic sentiment.
Pro Tip: Use seasonality as a bias filter, not a standalone signal. Combine with price action and macro data.
Volatility Cycles
The E-Mini Dow’s volatility often clusters around specific events:
- Quarterly Earnings Seasons: DJIA companies’ results can trigger outsized moves.
- Fed Decision Weeks: Average daily range can expand 20–30% compared to normal weeks.
- Geopolitical or Crisis Headlines: Sudden spikes in implied volatility — great for short-term breakout traders, but dangerous for unhedged positions.
Measured Volatility (based on ATR of last 10 years):
- Quiet Range: ~150–200 points/day ($750–$1,000 per contract).
- High Volatility: 350–500 points/day ($1,750–$2,500 per contract).
Advanced Strategies
Opening Range Breakout (ORB)
- Define first 30-minute range after the U.S. market open (8:30–9:00 a.m. CT).
- Go long on upside break / short on downside break with stop at opposite side of range.
- Works best in high-volatility market phases.
Intermarket Confirmation
- Track S&P 500 (ES) and Nasdaq (NQ) futures for correlated confirmation.
- If Dow lags during an S&P breakout, mean reversion trades can offer quick scalps.
Fed Day Fade
- Price often overreacts to the initial FOMC statement spike.
- Fade the extreme move once momentum slows and volatility mean-reverts.
Dow/S&P Spread Trade
- Go long YM / short ES when Dow’s breadth outperforms (often during strong industrial sector performance).
- Reverse when tech leads and Dow lags.
Risk & Money Management — Pro Level
Professional futures traders rarely risk more than 0.5–1.0% of account equity on a single YM trade.
Example Position Sizing:
If you have a $50,000 account and are willing to risk $500 (1%):
- With a stop-loss of 50 points ($250 per contract), you can trade 2 contracts maximum.
Advanced Tip: Adjust position size dynamically based on Average True Range (ATR) to maintain consistent dollar risk.
Tools & Resources for Competitive Edge
- CME Group FedWatch Tool – gauge rate hike probabilities before Fed announcements.
- Commitment of Traders (COT) Reports – track large speculator positioning.
- Market Internals (NYSE TICK, Advance/Decline) – confirm intraday momentum.
- Economic Calendar (Econoday, Forex Factory) – avoid getting blindsided by data drops.
Final Word for Advanced Traders
Trading the E-Mini Dow ($5) isn’t just about predicting direction — it’s about timing, managing risk, and leveraging market structure.
By blending:
- Seasonality bias
- Volatility awareness
- Correlated market analysis
- Strict capital discipline
…you can elevate your E-Mini Dow trading from basic speculation to consistent, repeatable performance.


 XAUT-USD
 AMD
AMD MARA
MARA SHOP
SHOP BULL
BULL CL=F
CL=F