
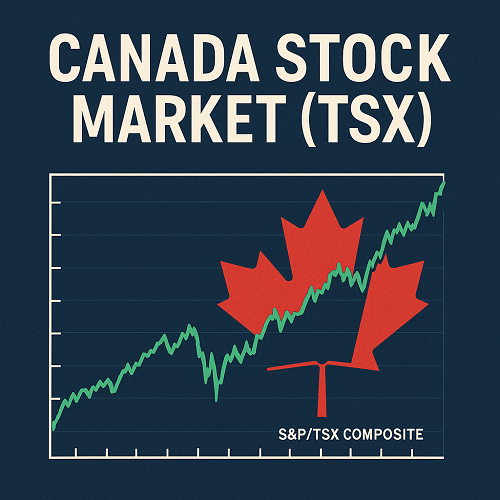
Why the TSX Matters
Canada’s stock market—primarily through the S&P/TSX Composite Index (“TSX”)—is the barometer for the country’s equity markets. It aggregates roughly 95% of Canada’s investable equity market by capitalization.
For domestic and international investors, the TSX offers exposure to key sectors such as energy, materials, financials, and mining—areas tightly linked to commodities and global cycles. Its performance often reflects not just Canada’s economic health, but also commodity demand, exchange rates (CAD vs USD), and interest rate dynamics.
Because TradingEconomics’ page is primarily a data dashboard (live quotes, charts, historical data) , there’s room to provide more narrative, analysis, strategy, comparisons, and tradeable insight in this article—to outrank it in search relevance.
What Is the S&P/TSX Index?
Definition & Structure
- The S&P/TSX Composite is a free-float, market cap–weighted index tracking ~230 companies listed on the Toronto Stock Exchange (TSX).
- It aims to capture ~95% of the Canadian equity market’s capitalization.
- Only freely tradable (i.e. non-restricted) shares are considered (“free-float”).
- Constituents are regularly reviewed for eligibility—removing illiquid names or replacing those with better-suited ones.
Key Variants & Sub-Indices
- S&P/TSX 60 — a subset of 60 large-cap names across sectors
- Sector indices — e.g. TSX Energy, TSX Financial, TSX Industrials, TSX Materials
- Total return version — includes dividends reinvested
- Broad-based variants — TSX SmallCap, TSX MidCap
TSX Composition & Sector Weightings (2025)
The strength (or weakness) of the TSX often depends on how its largest sectors perform. Here’s a breakdown:
| Sector | Approx. Weight | Key Influences |
|---|---|---|
| Financials | ~25–30% | Interest rates, credit spreads, housing & consumer debt |
| Energy & Materials | ~20–25% | Oil/gas prices, mining demand, commodity cycles |
| Industrials / Industrials & Manufacturing | ~10–15% | Infrastructure, global trade flows |
| Information Technology | ~5–10% | Software, hardware, innovation in Canada |
| Consumer Discretionary / Staples | ~5–8% | Consumer spending, retail environment |
| Utilities / Telecom | ~5% | Regulated rates, bond yields, stable cash flows |
| Others (Health, Real Estate, etc.) | residual | Niche or emerging plays |
These sector weights shift over time, especially when commodity prices surge (boosting energy & materials) or when interest rates change (impacting financials and utilities).
Understanding that the TSX is not diversified evenly is crucial: when commodities are weak, the index often suffers.
Historical Performance & Benchmarks
Long-Term Trends
- Over multi-decade spans, the TSX has tended to outperform during commodity supercycles and underperform when global industrial demand softens.
- Compared to U.S. indices like the S&P 500 or Nasdaq, the TSX can lag during periods of technology dominance but excel when energy and resource sectors rally.
- Dividend yields on the TSX have historically been higher, making it a favorite among dividend-seeking investors in Canada.
Recent Performance (2023–2025)
- In 2025 (year-to-date), the TSX has rallied significantly—powered in part by strength in gold and resource names.
- TradingEconomics reports that the TSX has shown YTD gains of ~20% in comparable metrics.
- Its volatility tends to spike during global selloffs, especially when commodity demand or global manufacturing slows.
Volatility & Correlation
- The TSX often shows strong correlation with commodity indices (e.g. energy, base metals, mining).
- It tends to be more volatile than many developed-market equities when global risk-off sentiment prevails.
Drivers & Macro Factors Influencing the TSX
To understand and forecast where the TSX is heading, one must monitor the following levers:
Commodity Prices & Global Demand
Energy (oil, gas) and mining (metals, minerals) are core to Canada’s economy. A rally in gold, copper, nickel, or oil tends to lift resource names and thereby boost the TSX.
Interest Rates & Monetary Policy
- Bank of Canada (BoC) decisions on rates, quantitative easing/tightening, and forward guidance weigh heavily.
- Rising rates hurt borrowing costs for companies and consumers; they also make dividends less attractive vs safer bonds.
- Conversely, rate cuts often stimulate capital flows into equities, especially dividend-driven names.
Canadian Dollar (CAD / USD)
Because Canadian equities often translate into U.S. or global currency exposure, when CAD weakens against USD, it can amplify returns for foreign investors.
Global Risk Sentiment & Yield Spreads
Periods of global risk aversion tend to depress equities broadly. The TSX, with its resource-heavy tilt, is susceptible to global growth slowdowns.
Fiscal & Trade Policies
Regional trade agreements, tariffs, or disruptions in U.S.–Canada trade can reverberate.
- For example, when U.S. levied tariffs on Canadian goods, the TSX faced pressure.
- Energy policy, environmental regulation, mining licensure, and infrastructure spending in Canada also matter.
Earnings & Corporate Health
Strong corporate results from major TSX constituents (banks, energy majors, miners) carry outsized weight. Downturns in oil, weak commodity demand, or credit stress can have outsized drag.
6Sectoral Outlook & Notable Constituents
Financials
- Heavily influenced by bank lending, mortgage performance, consumer debt, and interest spreads.
- Large names include RBC (Royal Bank of Canada), TD Bank, Scotiabank, Bank of Montreal, etc.
- Risks: rising loan defaults, margin compression, regulatory constraints.
Energy & Mining / Materials
- Core driver: global demand for oil, gas, uranium, copper, gold, lithium, etc.
- Mining firms also sensitive to geopolitical supply risk, exploration costs.
- Environmental regulations, carbon policies, and transition pressures are structural headwinds.
Industrials / Infrastructure
- Companies dealing with transportation, logistics, construction, equipment.
- Benefit from government stimulus, trade infrastructure spending.
Information Technology
- Canada is still nascent in large-cap tech names compared to U.S., but has growing names in fintech, AI, software.
- Higher growth potential, but also more volatility.
Utilities & Telecom
- Defensive, yield-oriented names.
- Sensitive to interest rates (higher rates reduce appeal) and regulation.
Real Estate & REITs
- Exposed to interest rates, mortgage markets, rental demand.
- Commercial real estate woes or credit issues could ripple into REITs.
Technical Analysis & Trend Signals (2025)
Below is a stylized, no-chart breakdown of technical & trend factors (you could embed charts):
Trend Structure & Moving Averages
- TSX is (as of mid-2025) in a strong uptrend, often trading above its 50-day and 200-day moving averages.
- Pullbacks often find support near the 50-day MA in strong markets; breaches of the 200-day MA signal regime change.
Momentum Indicators
- RSI (Relative Strength Index) occasionally enters overbought (>70), warning of near-term pullbacks.
- MACD crossovers (especially above zero) tend to precede continuation momentum.
Support & Resistance Zones
- Major support clusters often align with psychological round numbers (e.g. TSX = 28,000, 30,000).
- Resistance zones may appear near prior highs or commodity-peaked periods.
Volume & Breadth
- Broad participation (i.e. many sectors advancing) tends to signal sustainable uptrends.
- Volume spikes on corrections or breakdowns are red flags.
- Advancers vs decliners, new highs, McClellan Oscillator — useful breadth metrics.
Corroboration with Commodities & USD Index
- TSX often confirms or contradicts commodity direction. If gold or base metals weaken, TSX may lose steam.
- USD strength (dollar index rally) is often correlated with commodity weakness—which can drag TSX.
In short: TSX in 2025 exhibits strong trend momentum, but with caution zones around extended valuations and overbought conditions.
How to Trade / Invest in the TSX
Here are practical strategies for traders, medium-term investors, and long-term holders.
Direct Index Exposure
- TSX ETFs — e.g. iShares S&P/TSX Capped Composite Index ETF (XIC) or similar.
- Futures / Index derivatives — for advanced traders, using TSX futures or options (if available).
- Index mutual funds — benchmarked to TSX.
Sector or Thematic Plays
- Rather than broad exposure, you can overweight resource names during commodity rallies.
- Alternatively, rotate to financials, infrastructure, or tech when fundamentals shift.
Individual Stocks
- Select high-conviction names from within TSX sectors. Use bottom-up stock picking.
- Hedge via options or pairs (e.g. long a bank, short a commodity name) if sector tilts are extreme.
Hedging & Risk Management
- Use protective puts or collars on equity exposure during volatile periods.
- Maintain cash buffers.
- Diverge exposure (e.g. global equities, U.S. indices) to reduce Canada-specific risk.
Currency Considerations (USD / CAD Cross)
- If you are a foreign investor, FX fluctuations matter. Consider hedging FX exposure.
- A weakening CAD amplifies returns (in USD terms), but a stronger CAD can erode gains.
Timing & Entry
- Look for pullbacks to trend support (50-day MA, trendlines) for entry.
- Confirm with momentum signals, volume, breadth.
- Avoid chasing tops unless there’s a strong breakout with confirmation.
Risks, Challenges & Headwinds
No market is without risk. For the TSX, some key risk vectors:
Commodity Cycles & Demand Slumps
A global slowdown, overcapacity in mining, weaker oil demand—these can derail TSX returns.
Rising Interest Rates & Tightening
If inflation surprises, central banks may tighten rather than cut, raising borrowing costs and valuation discounting.
Regulatory & Policy Risk
Environmental, carbon, mining regulation, energy transition policies can hurt resource and energy firms.
Global Recession & Risk-Off
When investors flee to safety, emerging-leaning or resource-heavy markets like Canada tend to suffer.
Corporate & Credit Risk
Banking stress, consumer debt defaults, corporate leverage—especially in commodity names—can propagate.
Overvaluation & Sentiment Reversal
Extended rallies, exuberant sentiment, or technical blowoffs often end in sharp corrections.
Currency Volatility
Sudden CAD re-ratings (due to interest differentials or capital flows) can erode investor returns.
Forecasts & Scenarios (2025–2026)
Base Case (Moderate Growth)
- TSX continues upward with modest 5–10% gains, driven by stable commodity demand and moderate rate cuts.
- Financials and energy lead, while tech grows steadily.
- Pullbacks of 5–10% possible, but recoveries follow.
Bullish Case
- Global growth, stimulus, commodity supercycle—TSX surges 15–20%+.
- Bank of Canada cuts aggressively, boosting yield-seeking flows into Canadian equities.
Bear Case
- Global recession or demand collapse—commodity prices crash, dragging TSX down 15–25%.
- Rates stay higher for longer, valuations compress, and sentiment sours.
Forecasts
- Some analysts expect TSX to reach new record highs by end-2025, but with volatility.
- Others caution that trade headwinds or commodity weakness may cap upside in 2025.
As always, scenario-based planning and risk controls should guide exposure.
Canada vs. Global Markets: Comparative View
| Feature | TSX | U.S. (S&P 500, Nasdaq) | Emerging / Global Indices |
|---|---|---|---|
| Sector Tilt | Commodity & Financial heavy | Tech & consumer heavy | Varies (often resource, export) |
| Volatility Sensitivity | High vs commodity cycles | High on sentiment shifts | Varies, often higher |
| Dividend Yield | Higher than U.S. average | Lower, growth oriented | Mixed |
| Correlation Drivers | Commodities, CAD, regional trade | Macro, earnings cycles, global tech | Commodity & growth cycles |
| Geopolitical / Trade | Sensitive to U.S. policy | Global macro, regulation | Export & supply chain exposures |
If global equity sentiment sours, the TSX may underperform U.S. indices because of its resource dependence. Conversely, during commodity upswings or CAD weakness, the TSX can outperform.
Conclusion & Strategic Takeaways
- The TSX is not just a data dashboard—it’s a dynamic, cyclical barometer of Canada’s economy, commodities, and global linkages.
- Its heavy tilt toward energy, mining, and financials gives both leverage and vulnerability to commodity cycles and rate regimes.
- To effectively trade or invest, combine macro-context (rates, global demand, CAD) with technicals and sector rotation.
- Scenario planning (bull, base, bear) helps to set boundaries on exposure and risk.
- Utilizing ETFs, derivatives, and individual stocks gives flexibility to express directional views, hedges, or income strategies.
 XAUT-USD
 AMD
AMD JNJ
JNJ MARA
MARA SHOP
SHOP UNH
UNH BULL
BULL EURUSD=X
 CL=F
CL=F