
The Trade Desk, Inc. (TTD) is a demand-side platform (“DSP”) that allows advertisers and agencies to buy digital advertising across formats and channels. The trade desk inc stock has been a topic of interest for investors. Their focus is on programmatic advertising and increasingly on CTV. Q2 FY2025 revenue grew to $694 m (+19 % YoY) with an adjusted EBITDA margin of ~39 %. Customer retention remained >95 %.
Key growth levers
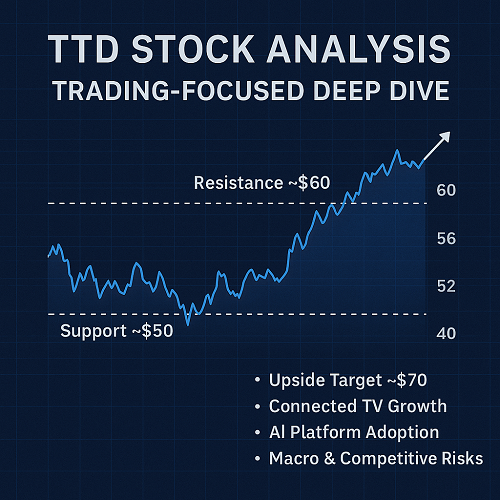
- CTV expansion: CTV remains their fastest-growing channel.
- AI platform (Kokai): They claim Kokai is driving better results (e.g., lower CPA, higher ROAS) for clients, helping differentiate from closed ecosystems.
- OpenPath / data transparency: supply-chain improvements and first-party data adoption are key for TTD’s positioning.
Key risks & headwinds
- Macroeconomic risk: large brand ad-spend is under pressure (tariff concerns, global uncertainty) — TTD flagged this.
- Execution risk: delays in platform rollout and structural reorganisation have weighed in recent quarters.
- Competitive risk: The ad-tech space features strong competition from closed-garden platforms (Amazon.com, Inc., Meta Platforms, Inc., Alphabet Inc.) which may erode TTD’s open-internet advantage.
Implications for trading
While fundamentals provide a bullish backdrop for TTD over the medium-term, from a trading perspective the key is to align timing and technical triggers: use the fundamental strength as a bias edge, but trade with strict risk controls and technical confirmation.
Technical Analysis & Trading Setups
Price context & key zones
- Current price ~ $52.
- According to short-term pivot calculations (WalletInvestor): pivot ~ $52.99, R1 ~ $53.98, R2 ~ $55.97, S1 ~ $51.01, S2 ~ $50.02, S3 ~ $48.03.
- On the weekly/monthly chart, the $50 region acts as a psychologically significant support zone (round number) and prior structural turning point.
- Resistance is clustered in the $55-$60 region (recent highs / consolidation zone).
Technical indicators
- On platforms like Barchart, the technical summary for TTD shows mixed signals: moving averages, MACD, RSI etc require monitoring.
- Given the down-move and consolidation near $50-$52, RSI likely shows some oversold/weakness, offering bounce potential if supported.
Trading setups
Setup A – Bounce from support
- Trigger: Price holds above $50 support (S2) and shows bullish confirmation (e.g., reversal candle, increased volume).
- Entry: Near ~$52 or upon clear breakout above ~$53.
- Initial target: ~$55-$57 (upper resistance band)
- Stretch target: ~$60 if momentum accelerates.
- Stop-loss: Below ~$50 or ~$48 (depending on risk tolerance) to limit downside.
Setup B – Breakout to upside
- Trigger: Break and hold above resistance ~$55.50 with strong volume.
- Entry: On breakout close above ~$55.50–$56.
- Initial target: ~$65-$70 (based on next structural resistance and analyst targets)
- Stop-loss: Near breakout (~$53) or below breakout candle to manage risk.
Setup C – Short trade / risk-management view
- Trigger: Failure to hold support at ~$50 and a break below ~$48 with volume.
- Entry: On confirmed break below support with follow-through.
- Target: ~$42-$45 (next prior support zone)
- Stop-loss: Just above ~$50 or recent bounce high.
Risk management & timing
- Trade size should align with risk control: e.g., risking 2-3 % of portfolio at most per trade.
- Use alerts + volume confirmation: breakthroughs on low volume are higher risk.
- Be aware of upcoming catalysts (earnings, ad-spend data, macro news) which can trigger volatility. E.g., next earnings date for TTD soon.
Catalyst Calendar & What to Watch
Upcoming catalysts
- Next earnings release: TTD’s next earnings announcement is scheduled (~Nov 6, 2025) according to recent listings.
- Ad-spend data: Reports on global advertising market, brand budgets, CTV spend will impact sentiment.
- Macro / trade policy developments: As flagged, tariff concerns and global brand spend drag are real risks.
Key events for traders
- Earnings guidance: Any change in growth outlook or margin commentary will trigger sharp moves.
- Kokai & platform updates: Progress on AI adoption and client roll-out will be closely watched.
- CTV growth metrics: Since this is key growth engine, any slowdown or acceleration will impact trader bias.
- Volume breakout: Technical confirmation via volume supports trading the setups outlined above.
News risk
- Negative surprises (e.g., ad-spend cuts, weaker guidance) can trigger stop-loss hits quickly — so stay nimble.
- Positive surprises (e.g., beat + raised guidance) might offer breakout opportunities but watch for quick retracements.
Trading Strategy Summary
Bullish bias (default)
Given the discounted price (~$52) and strong fundamental tailwinds, the bias leans bullish — but only with technical confirmation. Use Setup A or B as your guide.
Neutral/hedged view
If you hold a larger position or prefer less risk, you could scale in near support, place tight stops, and wait for breakout confirmation before adding.
Bearish possibility
If support fails and macro/competitive headwinds become more severe, Setup C (short) becomes viable — but this is riskier given the fundamental potential.
Time horizon
- Short-term trades (days to few weeks): Bounce or breakout trades above.
- Mid-term trades (few months): Hold through earnings and catalyst-driven moves if bias turns bullish.
- Use tighter stops on shorter trades; looser ones on mid-term holds if you believe fundamentals will drive upside.
FAQ – Traders’ Quick Questions
Q: Is TTD a buy right now?
A: From a trading perspective: yes — but only if you see technical confirmation (bounce at ~$50 or breakout above ~$55). Without it, wait.
Q: What’s the worst risk?
A: A breakdown below ~$48/50 leading to a drop toward ~$42-45. Also, earnings or ad-spend shock could invalidate the bull scenario quickly.
Q: What upside could we see?
A: Initial upside ~$55-57; if breakout, ~$65-$70 is realistic. Longer term analyst targets (~$84) indicate major potential.
Q: What should we watch on the chart?
A: Volume on breakout, closing above resistance (>$55.50), failure of support (<$50), and confirmation candles.
Q: How to set stop-loss?
A: For bounce setup: stop just below $50 (or ~4-5% below entry). For breakout setup: stop just below breakout candle (~$53).
Q: Will fundamentals matter for the trade?
A: Yes — they provide the bias “edge” (bullish), but trade decisions must be driven by price/volume action and risk management.
Recommended Next Steps for You (as Trader)
- Set alert for ~$50 support level being tested.
- Set another alert for ~$55.50 breakout trigger.
- Monitor TTD’s volume and momentum indicators (RSI, MACD) daily.
- Plan your entry/stop/target in advance: decide if you’ll trade bounce or breakout (or both).
- Keep an eye on sector-wide ad-spend data and macro headlines — these can drive outsized moves.
- Use proper trade sizing to manage risk.
- Record trade rationale and outcome to refine your process for future trades.
Final Thoughts
TTD presents a compelling trade opportunity right now: the shares are trading at a discounted entry point, the fundamentals (CTV growth, AI platform adoption) offer a strong tailwind, and the technical setup provides actionable levels for an active trader. However, as with all trades, the key is discipline, timing, and risk control. Do not assume price will automatically bounce — wait for confirmation. If support fails or a negative catalyst emerges, the trade becomes a short candidate.

 XAUT-USD
 AMD
AMD JNJ
JNJ MARA
MARA SHOP
SHOP UNH
UNH BULL
BULL EURUSD=X
 CL=F
CL=F