
“Most Active Stocks” are the beating heart of the stock market.
These are the tickers with the highest trading volume during a given session—often the center of institutional money flow, retail enthusiasm, catalysts, or breaking news.
Most active stocks attract traders because they typically offer:
- Better liquidity
- Tighter bid-ask spreads
- More predictable price movement
- Clearer intraday levels
- Stronger trend behavior
- Meaningful catalysts
Unlike static market-cap lists, the most active list changes every single day, reflecting real-time sentiment, fear, greed, and momentum.
What Defines a “Most Active Stock”?
A “Most Active” stock is ranked by trading volume, not by price or market cap.
Volume = the number of shares traded during a session
If AAPL trades 50 million shares today and TSLA trades 40 million, AAPL is more active — regardless of price.
Volume reflects:
- Market participation
- Liquidity
- Institutional interest
- Reactions to news
- Capital rotation between sectors
The most active list is a window into where the money is moving right now.
Why Trading Volume Is One of the Most Important Market Indicators
High volume means:
- More participants
- Strong conviction
- Higher probability of sustained moves
- Predictable breakouts/breakdowns
- Clearer intraday patterns
- Strength behind price
Low volume means:
- Weak interest
- Choppy movement
- False breakouts
- Wide spreads
- Higher slippage
In short: volume confirms validity.
When a stock is on the most active list, you know something is happening—and that’s exactly what traders want to see.
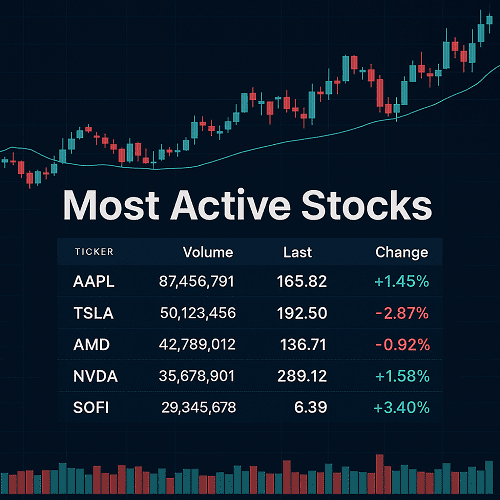
How to Read a Most Active Stocks List
A high-quality most active list shows:
| Metric | Meaning | Why It Matters |
|---|---|---|
| Volume | Shares traded | Identifies liquidity + interest |
| % Change | Price move today | Shows direction of sentiment |
| Price | Current share price | Determines risk and volatility |
| Market Cap | Company size | Helps measure institutional interest |
| Average Volume | Baseline activity | Useful for spotting unusual volume |
| Sector | Industry group | Helps see rotation + hot sectors |
A trader should never look at volume alone — context is key.
Key Metrics Traders Should Analyze
To outperform the average trader, go deeper than the default metrics.
1. Relative Volume (RVOL)
Shows how today’s volume compares to normal.
- RVOL of 1.0 = normal
- RVOL of 3.0 = triple normal activity
- RVOL of 10+ = unusual event (earnings, news, catalysts)
2. Float
Lower float = higher volatility.
- Low float < 20M
- Medium float 20M–100M
- High float > 100M
3. Short Interest
High short interest + high volume can create short squeezes.
4. ATR (Average True Range)
Measures volatility.
Higher ATR = more movement = more opportunities.
5. Institutional Ownership
Institutions dominate volume—institutional spikes = powerful moves.
Types of High-Volume Stocks (With Examples)
1. Megacaps
Example: AAPL, MSFT
- High stability
- Massive liquidity
- Perfect for day trading and scalping
2. News-Driven Movers
Example: A biotech FDA approval
- Extreme intraday volatility
- High RVOL
- Large breakouts
3. Earnings Movers
Example: TSLA on earnings day
- Heavy volume
- Trend-driven behavior
4. Small-cap Surges
Example: Low-float AI, biotech, or EV stocks
- Explosive moves
- High risk/reward
5. Sector Rotation Leaders
Example: Semiconductors, energy, financials
- Institutional rotation drives volume
How Institutions Influence Most Active Stocks
Institutions drive 60–80% of all market volume.
When hedge funds, mutual funds, or pension funds buy or sell, they generate:
- Massive block orders
- Algorithmic execution
- Dark-pool prints
- Intraday breakouts
Most active lists often highlight exactly where institutional flows are concentrated.
Why Retail Traders Love High-Volume Stocks
Retail traders love most active stocks because they provide:
- Clear trends
- Clean technical patterns
- Tight spreads
- Predictable momentum
- High liquidity
- Fast execution
These conditions are ideal for day trading and short-term strategies.
Trading Strategies for Most Active Stocks
Below are professional-grade strategies used by experienced traders.
Intraday Scalping Strategy (Professional Framework)
Indicators:
- VWAP
- Level 2 + Time & Sales
- EMA 9/21
- High-volume nodes
Setup:
- Stock appears in the most active list
- High RVOL (3.0+)
- Trading above VWAP = long bias
- Pullback to EMA9
- Entry on strong tape (T&S confirms buyers)
Profit Targets:
- Previous high
- Intraday resistance levels
Stop Loss:
- VWAP break
- Volume deterioration
Swing Trading High-Volume Stocks
Swing traders look for sustained volume after catalysts.
Checklist:
- Earnings beat
- Analyst upgrades
- Institutional inflows
- Sector strength
- Weekly chart breakout
Volume expansion on multiple timeframes = strong swing potential.
Breakout & Momentum Strategy
Volume confirms breakouts.
Rules:
- Wait for a break of a major level
- Confirm with high volume > 2× average
- Enter on retest or continuation
- Avoid breakout entries with low volume (fakeouts likely)
Mean Reversion in High-Volume Environments
Conditions:
- Parabolic spike
- Extreme deviation from VWAP or EMA21
- Exhaustion volume
- RSI > 80 or < 20
Mean reversion works best after unsustainable moves.
Risk Management Rules for Trading Active Stocks
Golden Rules:
- Risk 1% per trade
- Never chase a parabolic candle
- Respect VWAP
- Avoid low-float stocks unless experienced
- Size down during high volatility
Professional Stop-Loss Techniques:
- Hard stop
- Volatility stop (ATR)
- VWAP stop
Common Mistakes to Avoid
- Trading without a catalyst
- Entering low-volume breakouts
- Ignoring float size
- Oversizing positions
- Holding losers hoping for reversals
- Trading news without preparation
Best Screeners and Tools for Finding Most Active Stocks
Top tools:
- TradingView
- Thinkorswim
- Webull
- Market Chameleon
- Stocktwits (sentiment)
- Benzinga Pro (news + unusual volume)
- Finviz (free + excellent filters)
Sector-Specific Insights
Tech:
High volume, strong trends, macro-sensitive.
Energy:
Driven by oil/commodity prices.
Biotech:
Catalyst-heavy, high volatility.
Financials:
Macro-driven volume flows.
Consumer Discretionary:
React strongly to earnings and sentiment.
Case Study: How a Stock Becomes “Most Active”
Let’s break down a typical high-volume move:
Example Flow:
- Pre-market earnings beat
- Algorithmic buying triggers
- Analysts upgrade stock
- Retail crowds pile in
- Stock enters most active list
- Momentum funds rotate in
- Stock trends for the rest of the day
Volume = narrative + conviction + money flow.
How Market Conditions Affect Activity Levels
Bull Markets:
- Higher participation
- Volume follows trends
- More breakouts
Bear Markets:
- Defensive sectors dominate
- High volume in megacaps
- Volatility spikes
Sideways Markets:
- Rotation strategies
- False breakouts
- Choppy movement
FAQs: Most Active Stocks
What time of day has the highest volume?
- First hour (9:30–10:30 AM ET)
- Last hour (3:00–4:00 PM ET)
Are most active stocks good for beginners?
Yes — because liquidity reduces execution risk.
Do high-volume stocks always trend?
No. Some become active due to bearish catalysts (downgrades, disasters, etc.). Always analyze direction + catalyst.
What causes unusual volume?
- Earnings
- Insider buying
- Institutional rebalancing
- M&A activity
- Sector rotation
- Breaking news
Final Thoughts
The “Most Active Stocks” list provides one of the clearest windows into real-time market sentiment and institutional money flow. By understanding volume behavior, catalyst alignment, and price-action structure, traders can identify high-probability setups and avoid low-quality trades.
This guide is designed to help traders outperform the basics offered by typical market-activity pages, delivering deeper insights, actionable strategies, and a professional framework for navigating high-volume stocks with confidence.
 XAUT-USD
 AMD
AMD JNJ
JNJ MARA
MARA SHOP
SHOP UNH
UNH BULL
BULL EURUSD=X
 CL=F
CL=F