
Tesla (TSLA), listed as Nasdaq TSLA, is one of the most actively traded and closely watched stocks in the market. Its volatile price action, frequent news cycles, and strong retail/institutional interest make TSLA a prime candidate for options trading. Because of that, the TSLA option chain is one of the richest hunting grounds for volatility, directional plays, and income strategies.
But simply viewing the numbers on an option chain isn’t enough. To extract real value, you need to be able to interpret what those numbers are telling you, identify actionable setups, and manage the risk inherent in trading options of a highly volatile stock like Tesla.
In this guide, you’ll learn:
- How to read a TSLA option chain (calls, puts, volumes, open interest, implied volatility, Greeks)
- Advanced analytical tools and signals (skew, volatility term structure, max pain, unusual activity)
- High-probability strategies tailored for TSLA
- Real-world examples and trade ideas
- Pitfalls to avoid and how to manage risk
By the end, you’ll have a professional-grade framework to scan, analyze, and trade TSLA options more confidently than most retail traders.
What Is an Option Chain? (With TSLA Examples)
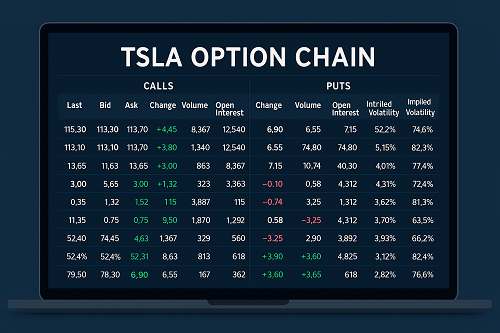
An option chain is a tabular listing of all available call and put options for a given underlying (here, TSLA) across different strike prices and expiration dates. Each line in the chain corresponds to a particular strike + expiration combination, with relevant data. The chain allows traders to see all the options available at a glance and compare their metrics.
A typical option chain shows:
- Expiration dates (weekly, monthly, quarterly)
- Strike prices (e.g. 300, 350, 400, etc.)
- For each strike: the call side and put side, with columns such as:
- Last price
- Bid / Ask
- Change (from prior close)
- Volume
- Open interest (OI)
- Implied volatility (IV)
- Sometimes the Greeks (delta, gamma, etc.)
On Nasdaq’s TSLA option chain page, they display these call and put tables side by side. The chain shows the key data points for each strike and expiration month.
Understanding these data points is critical. For example, a high open interest at a particular strike can signify where big players have placed risk; a sudden volume surge can hint at a directional bet; skew and volatility changes can clue you into expectations for future movement.
Interpreting Key Metrics in the TSLA Option Chain
To turn the raw numbers into insights, you must understand what each metric is and how it interacts with others.
Open Interest (OI)
- Definition: The total number of outstanding option contracts (calls or puts) that have not been exercised, offset, or closed.
- Interpretation: An increase in OI generally indicates new positions are being opened; a drop suggests positions are being closed or offset.
- In TSLA context, if you see a strike with massive open interest, that strike may act as a magnet (pin) near expiration or reflect significant hedging activity.
Volume
- Definition: Number of contracts traded in the day (or in the current session).
- Interpretation: Volume is a short-term signal of interest. A large volume spike relative to normal can hint at something significant.
- Always compare volume relative to the average volume for that strike.
Bid-Ask Spread
- Definition: Difference between the bid (what buyers are willing to pay) and ask (what sellers are asking).
- Interpretation: Wider spreads imply lower liquidity and higher transaction cost/slippage.
- In TSLA options (especially far out-of-the-money or low-volume strikes), spreads can be wide — be cautious.
Implied Volatility (IV)
- Definition: The market’s expectation of the stock’s future volatility, inferred from option prices (via pricing models).
- Impact: Higher IV = higher option premiums (all else equal).
- Volatility risk premium: TSLA often trades at elevated implied vol levels, so you’re paying for premium.
- Watch the volatility term structure (IV for near-term vs longer-term expirations) to gauge whether the market expects volatility to rise or fall.
Greeks (Delta, Gamma, Theta, Vega, Rho)
- Delta: Sensitivity of option price to changes in underlying price. For example, a call with delta 0.30 will gain ~$0.30 if TSLA moves up $1 (ignoring other factors).
- Gamma: Rate of change of delta (how delta moves as the price moves). High gamma = more sensitivity.
- Theta: Time decay; how much option price erodes per day (all else equal).
- Vega: Sensitivity to changes in implied volatility.
- Rho: Sensitivity to interest rates (less significant for most equity options in short horizons).
In TSLA, because the stock is volatile, gamma and vega can be especially meaningful.
Moneyness & Intrinsic vs Extrinsic Value
- In the Money (ITM): Call strike < underlying price (for calls) or put strike > underlying price (for puts).
- Out of the Money (OTM): Call strike > underlying, put strike < underlying.
- At the Money (ATM): Strike closest to current underlying price.
- Intrinsic value: Portion of option value if exercised immediately.
- Extrinsic (time) value: The remainder (premium) that accounts for time to expiration, volatility, etc.
Advanced Tools & Concepts in TSLA Option Chains
This is where you can go from a “basic chain user” to an advanced trader.
Volatility Skew / Smile / Term Structure
- Volatility Skew / Smile: Patterns where IV differs systematically across strikes (e.g. higher IV for out-of-the-money puts than calls).
- Term Structure: How IV behaves across different expiration dates. If near-term IV is higher than long-term, you have a backwardation in vol; vice versa is contango.
- TSLA often exhibits strong skew because of downside hedging demand.
Max Pain / Pin Risk
- Max pain (or “pain point”) is the strike price at which option buyers lose the most, i.e., the point of maximum pain for option holders. Market makers sometimes “pin” the stock toward that strike near expiration.
- Knowing where max pain lies in TSLA’s chain can help you anticipate potential pinning behavior.
Unusual Options Activity & Flow
- Watch for large block trades, sweep orders, open interest jumps, and disproportionate volume in deep OTM strikes.
- Such flows may signal institutional positioning ahead of news or volatility.
Gamma Squeeze / Volatility Spikes
- A gamma squeeze occurs when large option positions force dealers to hedge by buying the underlying, which can exacerbate price moves.
- Since TSLA is often subject to wild moves, gamma squeezes and volatility bursts are not rare.
Expiry Behavior (“Pinning,” Volatility Crush)
- As options expire, underlying stocks often gravitate to strikes with high OI — this is pinning.
- After a major event (e.g. earnings), implied volatility often collapses (“vol crush”) sharply — long option holders suffer.
How to Read TSLA Option Chain on Nasdaq
Here’s a step-by-step approach:
- Select the expiration you’re interested in (weekly, monthly, further out).
- Filter or scroll strikes around the current TSLA price (ATM, ITM, OTM).
- Sort by volume or open interest to find active strikes.
- Highlight unusual activity (e.g. sudden jump in volume vs OI).
- Compare implied volatility across strikes and expirations (skew, term structure).
- Look at bid-ask spreads to avoid illiquid strikes.
- Annotate possible support / resistance strikes if many OI clusters around them.
- Cross-check with other platforms like Yahoo Finance, MarketBeat, TipRanks to validate data and get alternative perspectives.
(You can annotate your own example screenshot or mock chain with colors, arrows, and notes.)
TSLA Options Trading Strategies & Use Cases
Given TSLA’s volatility, certain strategies work better than others. Below are common ones adapted to TSLA.
Long Calls / Long Puts
- Pure directional bets: if you expect a strong rally, you might buy a call; if you expect a sharp drop, buy a put.
- High risk, high reward. You need enough movement to overcome premium + time decay.
Covered Calls / Cash-Secured Puts
- If you own TSLA already, sell covered calls to generate income.
- If you want to own TSLA, sell cash-secured puts — you collect premium and may get assigned.
Vertical Spreads
- Bull Call Spread (buy call, sell higher-strike call) limits upside but reduces cost.
- Bear Put Spread (buy put, sell lower-strike put) for downside plays.
Iron Condors / Butterflies
- Use when you expect a range-bound TSLA movement.
- Limit risk and potential reward.
- Must monitor implied volatility and be careful if volatility runs against you.
Straddles / Strangles
- Long straddle = buy call + put at same strike.
- Long strangle = buy call + put at different strikes (cheaper).
- Good when you expect large move but unsure of direction (e.g. ahead of earnings).
Ratio / Broken Wing Spreads
- More complex multi-leg plays to skew risk/reward.
- Be cautious — margin and assignment risk increase.
Risk Management & Position Sizing
- Don’t risk too much capital on single TSLA option because volatility and swings can be brutal.
- Use stop-loss (or mental stops), hedges, and consider scaling in/out.
- Monitor positions closely, especially near earnings or major news.
Real-World Example (Hypothetical)
Let’s say TSLA is trading at $420. You see heavy open interest at the $430 call for a monthly expiration and a sudden spike in volume at $440 calls. You might buy a bull call spread:
- Buy TSLA $425 call
- Sell TSLA $435 call
- Use the premium differential to limit cost and define your risk.
- If TSLA rallies strongly, you may profit; if it stagnates or falls, your loss is limited to net debit.
You can simulate P&L curves, break-even, and anticipate adjustments (rolling, closing mid-way) depending on what the chain tells you.
How to Spot & Exploit Trading Opportunities
Here are some signals and setups you should watch for:
- Skew Breakouts: A sudden shift in implied volatility at one side of the chain may indicate directional bias.
- Volatility Divergence: If IV drops in near-term but rises in mid-term, it can suggest upcoming shock.
- Large Block Trades / Sweep Orders: Follow “big money” flow.
- Open Interest Jumps: Unusual jumps in OI at one strike may hint at accumulation.
- Gamma Flow near Expiry: As you approach expiration, option writers may force hedging moves that exaggerate price action.
- Catalysts: Earnings, product announcements, guidance — use option chains to structure low-risk plays ahead of known events.
For example: if TSLA is about to announce earnings, you might buy a straddle in the weekly or biweekly expiration, expecting a sharp move. But be careful of “vol crush” — implied volatility may drop after the announcement, hurting your position.
Risks, Pitfalls & Common Mistakes
Even the best traders make errors. Here are frequent traps:
- Paying too much for volatility: You may overpay for implied vol spikes.
- Wrong expiration choice: Too short = time decay; too long = wasted premium.
- Slow to react: TSLA moves fast — missing exit signals can be disastrous.
- Ignoring liquidity: Wide spreads or low volume strikes can kill returns.
- Holding through earnings without hedge: IV crush can wipe profits even if direction is correct.
- Overleveraging: TSLA’s volatility can magnify losses.
Always treat TSLA option trades as high-stakes — cut losses, respect sizing, and avoid emotional decisions.
Comparative Platforms & Tools for TSLA Option Chains
While Nasdaq has the official chain, many traders prefer additional platforms because they offer analytics, flow, and better UX.
| Platform | Strengths | Limitations |
|---|---|---|
| Nasdaq | Official, stable, reliable data, side-by-side chain view | Lacks advanced flow tools or scanning |
| Yahoo Finance | Simple UI, good for quick checks | Limited analytics, delay |
| MarketBeat | Easy export, comparative chain view | May lack depth |
| TipRanks | Option pricing + analytics | User interface can lag |
| MarketChameleon | Heat maps, scans, flow tools | Some features behind paywall |
| OptionCharts / OptionCharts.io | Strategy visualizations, detailed chains | May have UI learning curve |
| TradingView | Good chart + option overlay tools | Not full chain depth |
If you’re serious about TSLA options, combining multiple data sources + a heat map / scanner toolbox will give you an edge.
Case Studies & Backtesting Ideas
Case Study: Post-Earnings Straddle
Suppose TSLA historically moves ±8–12% on earnings. You backtest:
- Buy straddle (call + put) ~7 days before earnings
- Record net returns over multiple quarters
- Factor in implied volatility changes
You may see that sometimes the move is muted and the IV crush is too strong — many profits come from correctly timing or adjusting mid-event.
Case Study: Skew Break + Gamma Squeeze Setup
You observe over several days that the IV in OTM calls is increasing much faster than in OTM puts. You open a ratio call spread anticipating a sharp move upward and manage actively by rolling or converting to naked calls if the breakout accelerates.
Results: you capture the upside, and gamma flow helps propel further movement — but if the move fails, your defined losses limit damage.
Lessons: adapt dynamically; always test strategies historically; avoid fixed blind bets without context.
FAQs — Common Questions About TSLA Option Chains
Q: What is the most active TSLA strike?
A: It often varies, but typically near-the-money strikes (±$10 or $20 from the current price) see the highest volume and open interest.
Q: How far out should I trade TSLA expiration dates?
A: For directional bets, 30–60 days out gives balance between time decay and cost. For volatility plays, weeklys may generate sharper moves.
Q: Should I trade weekly or monthly TSLA options?
A: Weeklies allow for precision and capturing short-term events but carry higher risk and time decay; monthlies provide cushion but cost more premium.
Q: What’s the typical implied volatility range for TSLA options?
A: TSLA typically trades at elevated IV compared to more stable stocks — you’ll often see IVs in the 80–150% annualized range (this can compress or expand with news).
Q: How do I manage early assignment risk in TSLA options?
A: Monitor deep ITM short calls or puts, especially close to ex-dividend dates (though TSLA doesn’t often have dividends). Maintain sufficient margin and be ready to be assigned, or close the position early.
Conclusion & Next Steps
TSLA options present both exciting opportunity and elevated risk. The complexity of its option chain data, skew, volatility, and heavy institutional flows rewards those who approach with structure, discipline, and a well-honed analytical process.
Key takeaways:
- Master reading the chain: volume, open interest, IV, Greeks
- Use advanced tools like skew, gamma flow, and unusual activity to inform your trades
- Choose strategies compatible with TSLA’s volatility profile
- Always emphasize risk management — exit rules, hedges, sizing
- Practice, backtest, iterate
Next steps:
- Take a recent TSLA option chain and annotate it manually (strike clusters, IV skew, volume spikes).
- Paper-trade a simple vertical spread based on a chain signal.
- Track your trades and refine which signals are robust.
- Consider integrating a flow scanner or options heat map tool.

 XAUT-USD
 AMD
AMD JNJ
JNJ MARA
MARA SHOP
SHOP UNH
UNH BULL
BULL EURUSD=X
 CL=F
CL=F