
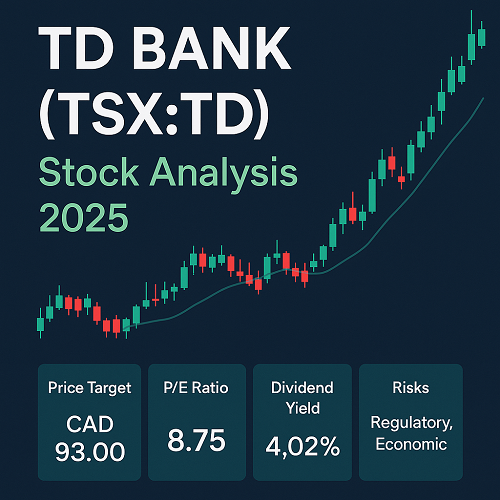
Overview of Toronto-Dominion Bank (TD)
- Ticker / Exchange: TD on the Toronto Stock Exchange (TSX:TD)
- Headquarters: Toronto, Ontario, Canada
- Founded: February 1, 1955
- CEO: Raymond Chong Ho Chun
- Sector / Industry: Financials — Major Banks
TD Bank is one of Canada’s Big Five banks, offering a full suite of financial services: personal and commercial banking, wealth management, insurance, wholesale banking, and a corporate segment supporting internal services. It has strong presence both in Canada and the United States.
Business Model & Segments
TD’s business is organized into multiple segments:
- Canadian Personal and Commercial Banking: Traditional deposit, savings, payment and lending products.
- U.S. Retail: Personal and business banking, wealth management in the U.S.
- Wealth Management & Insurance: Advice-based, direct investing, asset management, insurance.
- Wholesale Banking: Institutional, government, corporate services, capital markets.
- TradingView
This diversified structure helps TD offset geographic or cyclical risk. The U.S. operations provide growth exposure but also bring regulatory risk and foreign exchange considerations.
Recent Financial Performance
Here are some high-level metrics (TTM = trailing twelve months where applicable):
| Metric | Value |
|---|---|
| Market Cap | ≈ 186.24 billion CAD |
| Price-to-Earnings Ratio (TTM) | ≈ 9.10 |
| Basic EPS (TTM) | ≈ 11.69 CAD per share |
| Annual Revenue | ≈ 120.14 billion CAD |
| Net Income (Latest Fiscal Year) | ≈ 8.84 billion CAD |
| Dividend Yield (Indicated) | ≈ 3.95% |
| Shares Outstanding / Float | Float ≈ 1.75 billion shares |
| Beta (1-Year) |
Recent Trends
- Over the past 6 months, TD has increased ~25.4% in value; year-to-date up ~38.96%
- Over 1 year, ~26.97% growth. The longer term (5 years) returns are also positive, though yield and volatility are factors to weigh.
Valuation Metrics & Key Ratios
To assess whether TD is fairly valued, undervalued, or overvalued, key metrics:
| Ratio | What It Tells Us | Current TD Value | Interpretation |
|---|---|---|---|
| P/E (TTM) | How many years of earnings the price reflects | ~9.10 | Quite low — suggests cheap relative to earnings, potentially good value, especially for a bank with stable earnings. |
| Dividend Yield | Income return just from dividends | ~3.9-4% | Attractive yield for a major bank; must check payout ratio and sustainability. |
| Payout Ratio | (Dividends paid) / (Net income) | — (data point not fully in TradingView snippet) | Need to verify: high payout ratio could risk dividend cuts under stress. |
| Return on Equity (ROE) / Return on Assets (ROA) | Efficiency & profitability | (Not in snippet) | Important to gather from latest financial filings. |
| Growth in Revenue & Profit | Trend of earnings over time | Revenue ~120.14B CAD, net income ~8.84B CAD | Growth seems steady; need to check quarterly trends for U.S. vs Canada breakdown. |
Dividend History & Income Potential
- Indicated dividend yield ~ 3.9-4% is attractive in Canadian bank context.
- Dividends are paid quarterly.
- Key concerns: payout ratio (how much profit is being returned vs retained) and regulatory or economic stress (e.g. credit losses, rate changes) that could squeeze profits.
Investors seeking income should also consider dividend growth — are dividends increasing in line with inflation & earnings? Historical growth rates matter.
Technical Analysis & Price Trends
Price Performance
- Recent returns: ~ +3-4% in 1 month; strong growth over past 6 months.
- More long-term gains: ~26-30% over one year. 5-year performance also positive but slower CAGR.
Volatility & Beta
- Beta ~0.61 indicates lower sensitivity to market swings. Less volatile than broader market — useful for more risk-averse investors.
Technical Signals
- Based on TradingView, current technical rating is “Neutral” or mixed (some indicators leaning buy, others more cautious)
- Support/resistance levels are key: price behavior around prior highs, moving averages, volume clusters.
7. Risks & Catalysts
Catalysts (Upside Potential)
- Strong Canadian & U.S. banking operations: If U.S. economy continues stable or improves, the U.S. segment can drive growth.
- Interest rate environment: Rising interest rates often favor banks (bigger net interest margin), unless rates get so high they hurt borrowers.
- Operational efficiency & technology: Cost control, digitization, improving customer experience.
- Regulatory tailwinds or trade agreements: Could open cross-border opportunities.
Risks (Downside / Headwinds)
- Economic downturns / credit risk: Loan losses could rise in recessions or if certain sectors (e.g., real estate) weaken.
- Regulatory / legal risk: Fines or litigation (money laundering or compliance issues) can hurt reputation & costs.
- Interest rate volatility: Sharp drops (or inverted yield curves) may squeeze margins.
- Foreign exchange risk: U.S. operations expose TD to USD/CAD fluctuations.
- Competition & fintech disruption: Pressure from non-traditional banking, digital banks, etc.
Forecasts & Analyst Opinions
- Analysts’ estimated price range tends to cluster (from what TradingView shows) into a low estimate around CAD 93.00 and a high estimate around CAD 120.00.
- With current trading around CAD 106-110 (or near full value vs. high forecast), upside might be moderate unless new catalysts emerge.
Longer-term projection:
- If TD can maintain earnings growth, keep dividend payout stable, and avoid major losses, then 3-5 yr total returns (capital + dividends) could be in the ~6-10%/yr range, assuming no major disruptions.
- In bear scenarios (economic stress, regulatory penalties), downside could be material.
How to Invest in TD — Strategies & Considerations
Investment Strategies
- Dividend Income Portfolio: TD makes sense as a core holding for income. Consider buying on dips, reinvesting dividends.
- Balanced Growth / Value Play: The low P/E and stable earnings make it appealing for value investors.
- Risk-Adjusted Exposure: Due to lower beta, it can help dampen volatility in an equity portfolio.
Practical Considerations
- Monitor U.S. vs Canadian segment performance — exchange rates, regulatory differences, credit risk.
- Watch the interest rate outlook: central bank policy (Bank of Canada, U.S. Fed) will affect margins.
- Keep up with TD’s capital adequacy, loan loss provisions, and any legal or compliance issues.
Frequently Asked Questions (FAQs)
Q1: What is the current stock price of TD (TSX:TD)?
A: As of the last market close, it hovers around CAD 106.96. Note: this can change — always check live markets.
Q2: What is the dividend yield and is it safe?
A: Dividend yield is about 3.9-4%, paid quarterly. Safety depends on earnings stability and payout ratio. So far, TD has used a large portion of earnings to pay dividends, but unless profits take a hit, it looks sustainable.
Q3: Is TD a good buy right now?
A: It depends on your time horizon and risk appetite. If you value income, stability, and modest growth, TD is attractive. If you anticipate economic troubles or prefer high-growth companies, there may be better alternatives. Long-term upside exists, but not huge if you’re already at or near analyst high estimates.
Q4: How volatile is TD stock?
A: With a beta around 0.61, it’s less volatile than the overall market—meaning less dramatic swings. Good if you want smoother ride, but also less upside in bull surges.
Q5: When is TD’s next earnings report?
A: TradingView (per its data) doesn’t list a confirmed next earnings date in the snippet. It is useful to set alerts via official TD investor relations to catch filing dates.
Conclusion
Toronto-Dominion Bank (TSX:TD) is a strong blue-chip banking stock in Canada, offering:
- A solid dividend yield
- Reasonable valuation (low P/E)
- Diversified business across Canada & U.S.
However, it faces risks from macroeconomic conditions, regulatory pressures, and interest rate fluctuations. For investors seeking income and stability, TD is a compelling holding. For those looking for high growth, other sectors might offer more upside.

 XAUT-USD
 AMD
AMD JNJ
JNJ MARA
MARA SHOP
SHOP UNH
UNH BULL
BULL EURUSD=X
 CL=F
CL=F