Market Reaction at a Glance
Index Moves & Intraday Behavior
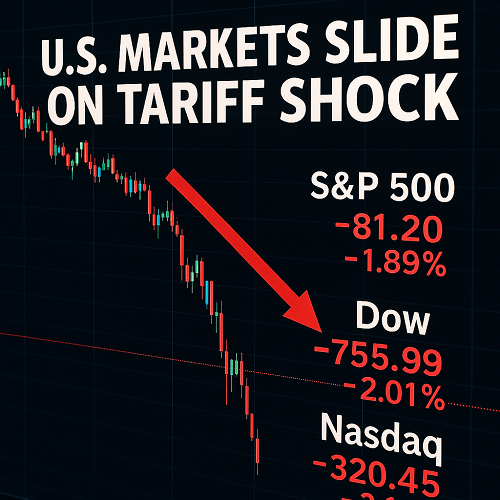
- The S&P 500 dropped over 1%, logging one of its worst sessions in weeks.
- The Nasdaq fell more steeply (≈1.5%–2%) as growth/tech names were more exposed.
- The Dow Jones also declined, dragged by industrials and export-sensitive stocks.
- Breadth was weak: a large proportion of S&P 500 constituents were in the red.
- Volatility spiked, implied volatility indices (VIX) moved higher, and safe havens like Treasury bonds and gold saw inflows.
(These dynamics mirror what other live coverage sources report.)
Comparisons to Prior Episodes
This selloff resembles flash declines triggered by geopolitical or policy shocks (e.g. past tariff escalations). The surprise element amplifies market reactions, especially when conditions are calm heading in.
Catalyst Deep Dive: Tariff Escalation & Rare Earths
What Trump Announced
President Trump, via social media and press channels, threatened to impose massive new tariffs on Chinese imports in retaliation to Beijing’s decision to implement export controls on rare earths and critical minerals.
These materials are essential for technologies like electric vehicle batteries, defense systems, and electronics, giving Beijing strategic leverage.
Why It Spooked Markets
- Global Supply Chain Risk: These materials are integral to high-tech value chains. Disruption could cascade across sectors.
- Escalation Risk: Markets fear a return to full-blown trade war conditions, which suppressed growth prospects.
- Policy Uncertainty: Investors are weary of sudden regime shifts, non-linear tariff shocks, and less predictable diplomacy.
- Leverage & Retaliation: China can counter with its own trade measures; there is also the risk of broader sanctions or export controls.
How This Fits Into the Bigger Picture
- Earlier in 2025, markets were roiled by tariff announcements (e.g. “Liberation Day” tariffs) that sparked multi-day crashes.
- Trump’s hardline rhetoric has been a recurring swing factor. Today’s move signals he may lean harder, not softer, on trade policy.
Macro & Sentiment Backdrop
Inflation, Rates & Yields
- Inflation continues to hover above target in the U.S., putting pressure on the Federal Reserve to maintain hawkish bias.
- The 10-year U.S. Treasury yield is under stress: in risk-off modes, yields often fall initially, then later can rebound if credit risk concerns appear.
- The yield curve (e.g. 2Y vs 10Y) is a critical gauge: further inversion could signal recession risk.
Economic Growth & Corporate Earnings
- Growth is already showing signs of softening, particularly in manufacturing and export-dependent industries.
- Companies with China exposure (components, semiconductors, autos) may feel the pinch in supply lines, input costs, and demand.
Sentiment & Risk Appetite
- Implied volatility indices (VIX) are rising, and option skew suggests growing tail risk.
- Hedge funds and institutional players may adopt shorter horizons, increased hedging, or reduced directional exposure.
Technical Analysis: Key Levels & Patterns
S&P 500
- Support zones: Prior consolidation zones and 50-day moving average.
- Resistance zones: Recent highs and trendline channels.
- Watch for breakdowns below the near-term range to signal continuation.
Nasdaq / Tech
- More volatility-prone; tech names may test strong support zones (e.g. prior breakout levels).
- Leadership stocks in semiconductors, AI, and growth sectors likely to lead any rebound or further downside.
Dow Jones
- Likely to find support around industrial component levels but vulnerable to global trade shocks.
Patterns & Signals
- Bear flags or descending triangles could form.
- Volume spikes on declines are bearish.
- Volume divergence (prices falling on high volume) adds conviction to the move.
Sector Winners & Losers
| Sector | Likely Losers | Possible Beneficiaries | Rationale |
|---|---|---|---|
| Semiconductors / Tech / EV | Sensitive to rare-earth disruption | Some niche domestic players | Input cost pressure, supply fragility |
| Materials / Mining | Exposure to Chinese mining supply chains | Domestic rare-earth producers | Price gains amid export restrictions |
| Industrial / Machinery / Components | Those reliant on global supply chains | Some defense / strategic materials | Disruption in component flow |
| Consumer / Discretionary | High-end electronics, imports | Staples, defensive names | Shift to safer consumption |
| Safe Havens / Bonds / Gold | — | Bonds, gold, dollar | Capital flight to safety |
MP Materials and USA Rare Earth saw sharp gains on this news.
Strategy Playbook: What to Do Now
Short-Term (Intraday to 1–3 Days)
- Scalp or trade volatility: use options or short-term directional trades.
- Fade overreactions: if oversold, watch for mean reversion bounces.
- Use hedges: protective puts or inverse ETFs, tight stops.
Medium-Term (3–21 Days)
- Selective long entries in sectors likely to benefit or recover.
- Layered entries: stagger positions rather than all-in.
- Pairs trades: long defensives, short cyclicals.
Long-Term (1–3 Months)
- Reduce directional risk: favor ETFs with lower betas.
- Asset rotation: shift toward income, value, or non-U.S. equities.
- Track policy signals: central bank guidance, trade diplomacy.
Option Strategies
- Volatility selling (iron condors) if rangebound.
- Long straddles/strangles on event windows (e.g. trade announcements).
- Ratio spreads or collars in equities under pressure.
Risk Management & Position Sizing
- Max drawdown tolerance: define acceptable loss per trade (e.g. 1–2% of capital).
- Stop-loss discipline: use technicals to place stops (e.g. below support).
- Size scaling: start small and scale in if momentum confirms.
- Cross-asset hedges: in volatile markets, some exposure to bonds/gold/dollar may buffer equity losses.
Watchlist: Indicators & Headlines
Key Macro & Policy Triggers
- Chinese export policy changes (especially rare earths).
- U.S. Treasury / Commerce announcements on tariff implementation.
- Fed speeches and inflation data (CPI, PCE).
- Leading economic indicators (PMIs, ISM, durable goods).
- Geopolitical distraction: trade talks, diplomatic summits.
Technical / Market Indicators
- VIX and implied volatility skew.
- Treasury curve (2Y / 10Y spread).
- Volume & breadth measures (advance-decline line).
- Sector rotation metrics.
- Options open interest in key names.
Conclusion
Today’s selloff underscores how fragile markets are when confronted with geopolitical surprises, especially in trade relations. Even in a period of relative calm, a sudden policy jolt (like “massive tariffs”) can upend sentiment, force volatility spikes, and rewire flows.
For traders, the priority is flexibility: shift between offense and defense, respect technical levels, and never assume linearity in reaction to policy. Keep your risk tight, monitor developments closely, and adapt quickly as the narrative evolves.


 XAUT-USD
 AMD
AMD MARA
MARA SHOP
SHOP BULL
BULL CL=F
CL=F