
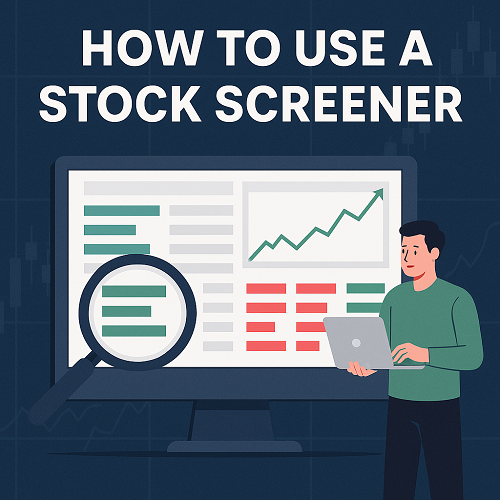
In the fast-moving world of equities, a robust stock screener is one of the most powerful tools a trader or investor can wield. The ability to filter thousands of stocks down to a manageable list based on custom criteria enables you to focus your attention where opportunity resides.
In this guide, you’ll learn:
- What a stock screener is and how it works
- Which metrics and filters matter most
- How to build and refine screening strategies
- Comparisons of leading free and paid screeners
- Real-world examples and case studies
- Backtesting, pitfalls, and best practices
By the end, you’ll have both the conceptual foundation and tactical framework to use screeners to discover stocks that match your edge.
What Is a Stock Screener?
A stock screener (or equity screener) is a software tool that allows users to filter publicly traded stocks based on one or more predefined or custom criteria.
Purpose & Value
- Focus your research: Rather than scanning thousands of tickers, you narrow to those that meet your criteria (e.g. P/E < 20, revenue growth > 20%).
- Generate trade ideas: Screeners are idea engines — many traders start their watchlist via a screener.
- Backtesting inputs: Use screener output as input to backtests or further quantitative systems.
- Speed & consistency: Automate repetitive filtering so you don’t miss opportunities.
How It Works (Technically)
Under the hood, a stock screener queries a database of stock fundamentals, technicals, financial statements, price data, and possibly alternative data (e.g. sentiment, insider trades). The user’s filters get translated into database-level queries or indices, returning only the tickers that match all (or any) selected filters.
Some advanced screeners support real-time streaming filters, alerting, or API access so that as soon as a stock meets your criteria (e.g. crosses a moving average), you’re alerted.
Key Metrics & Filter Categories
To build effective screeners, you need to understand the common categories and metrics. Here’s a structured breakdown:
| Category | Common Metrics / Filters | Why It Matters | Use Case Examples |
|---|---|---|---|
| Fundamental / Valuation | P/E, P/B, EV/EBITDA, PEG, Price/Sales, Debt/Equity, Free Cash Flow growth | Helps identify undervalued or fairly valued stocks | Filter for P/E < 15 and PEG < 1.5 |
| Profitability / Efficiency | Net profit margin, ROE, ROA, EBITDA margin | Companies with strong profitability tend to be more resilient | ROE > 15%, margin above industry median |
| Growth | Revenue growth YoY / QoQ, EPS growth, cash flow growth | Growth is a key driver of returns | Revenue growth > 20% annually |
| Financial Health / Leverage | Current ratio, quick ratio, debt/EBITDA, interest coverage | Avoid financial distress | Debt/EBITDA < 3, interest coverage > 5x |
| Technical / Price | Moving averages (e.g. 50-day, 200-day), RSI, MACD, volume spike, price breakout | Many traders time entries via technicals | Stocks above 200 DMA with RSI < 70 |
| Relative / Comparative | Industry percentiles, peer ranking, Z-scores | To find outperformers vs peers | P/E in bottom 20% of peers |
| Momentum / Trend | Price momentum (3/6/12-month), relative strength, breakout velocity | Momentum is a persistent and exploitable phenomenon | 6-month returns in top decile |
| Quality / Moat | Gross margin stability, free cash flow consistency, earnings surprise history | To screen for more durable businesses | Consistent free cash flow > 5 years |
| Insider / Ownership / Sentiment | Insider buying, institutional ownership, short interest, analyst upgrades | Gauge human behavior and expectations | Insider purchases > certain $ threshold |
You don’t need to use all categories, but combining across them (e.g. growth + value + quality) tends to produce better candidates than relying on just one dimension.
How to Build a Screener Strategy (Step-by-Step)
Here’s a playbook to go from idea to actionable filtered list.
Step 1: Define Your Edge
Ask: What kind of stocks do I want?
Example edges:
- Low-valuation growth stocks
- Momentum breakouts
- Turnaround stories
- Dividend growth with safety
Step 2: Choose Core Filters (Topology)
Start with broad filters from two or three categories.
Example:
- Growth filter: revenue growth > 20% YoY
- Valuation filter: P/E < 25
- Quality filter: ROE > 12%, debt/EBITDA < 3
- Technical filter: price > 200 DMA
Step 3: Add Secondary Filters / Fine-Tuning
Add complementary or risk control filters.
- Exclude small market cap stocks (e.g. < $300M)
- Exclude extremely high volatility (e.g. beta > 3)
- Use relative percentile filters to weed out sector noise
Step 4: Backtest or Simulate Historically
Before you trust your screener, test it over historical periods.
- Run the filter at monthly intervals and record the resulting portfolios
- Simulate transaction costs
- Check survivorship bias, lookahead bias, slippage
Step 5: Iterate & Optimize
- Review false positives / misses
- Adjust thresholds (not too tight, not too loose)
- Time windows: e.g. growth measured over 3, 5, or 10 years
- Incorporate ranking & scoring — e.g. assign weights to each metric and rank top N
Step 6: Operationalize & Monitor
- Automate filters with alerts or API
- Schedule re-runs (daily, weekly)
- Track performance vs benchmark
- Prune or refresh filters over time
Examples: Top Stock Screeners (Free & Paid)
Here’s a sample of common stock screeners and how they compare (features to look for in a strong screener):
| Screener | Highlights / Strengths | Potential Limitations |
|---|---|---|
| Finviz (Free / Elite) | Easy interface, technical filters, real-time quotes in paid, built-in strategies | Fundamental depth is limited in free version |
| TradingView Screener | Strong charting integration, custom filter scripting | Less fundamental granularity than dedicated tools |
| Yahoo Finance Stock Screener | Widely known, high availability, basic filters | Limited real-time speed, few advanced metrics |
| Stock Rover | Deep fundamental data, scoring, backtesting, portfolio management | Slightly steeper learning curve, cost for higher tiers |
| Koyfin | Clean UI, visualizations, fundamental + technical combos | Some filters may require paid plan |
| Proprietary / Institutional (e.g. Bloomberg, FactSet) | Vast data, real-time, custom modeling | High cost, complexity, often for institutions only |
| Marketchameleon’s Screener Tools | (Assumed feature set) — likely robust derivatives, options flows, earnings impact, unusual volume filters | May require paid subscriptions, certain data access constraints |
Your ideal choice depends on your strategy, budget, and which data types you need.
Use Cases & Case Studies
Let’s walk through a few practical strategies you might run in a screener:
Growth + Value Crossover
- Revenue growth > 20%
- P/E < 30
- ROE > 15%
- Debt/EBITDA < 2
You might capture fast-growing names that are still relatively “cheap” compared to peers.
Momentum Breakout Strategy
- Stock price > 200 DMA
- 50 DMA crossing up over 200 DMA
- 6-month return in top decile
- RSI between 40 and 70
This finds trending stocks with room to continue upward.
Turnaround / Reversion Strategy
- Negative EPS in prior years, now EPS improving
- Free cash flow turning positive
- Insider buying or institutional accumulation
- Sector percentile rank improving
Look for companies emerging from distress.
Defensive / Dividend Growth
- Dividend yield > 2.5%
- Payout ratio < 60%
- Low debt/equity
- Stable cash flows over last 5 years
- Beta < 1.2
This builds a more stable “safe” filter list.
Pitfalls, Biases & Risks
Even the best screener won’t guarantee big gains. Here are common pitfalls:
- Overfitting: Too many filters tailored to past data can fail in future.
- Survivorship bias: Many backtests exclude delisted / bankrupt stocks.
- Lookahead bias: Using future info unknowingly in the filter.
- Slippage & transaction costs: Real-world trading eats into returns.
- Data discrepancies: Different providers report metrics differently (e.g. adjusted vs unadjusted earnings).
- Overcrowding: If many follow the same screen, trade opportunities may vanish.
- Ignoring the macro / sector context: A perfect filter may still get crushed in a sector collapse.
Best practice: run the screener live in paper mode for months before deploying capital, track its hits versus misses, and review continually.


 XAUT-USD
 AMD
AMD JNJ
JNJ MARA
MARA SHOP
SHOP UNH
UNH BULL
BULL EURUSD=X
 CL=F
CL=F