
Stock quotes are the fundamental building blocks of every investor’s toolkit. Whether you’re a long-term investor reviewing fundamentals or an active trader seeking market timing signals, knowing how to read and interpret a stock quote is far more than glancing at a number. In this 2025 edition guide, we’ll cover everything—from core components (bid, ask, last trade) to advanced metrics (Level 2 order book, liquidity indicators), show real-world examples, and provide actionable use cases for both novice and experienced investors.
According to TD’s article, a stock quote “can contain key information such as the bid and ask price, volume traded and last traded price.” We’ll go many steps further—showing how to use each element, what background questions to ask, and how to make better decisions accordingly.
What is a Stock Quote & Why It Matters
A stock quote is essentially a snapshot of the market’s current willingness to buy or sell a share of a publicly-traded company. It includes several data points that together give you a live or near-live view of market sentiment, liquidity, valuation and momentum.
Definition
- The “quote” shows at what price shares are trading, the highest bidder, the lowest seller, volume, and often additional metrics such as previous close, open, day high/low, 52-week range, P/E ratio, market cap, etc.
- The price you’ll see is often the last trade price: the price at which the most recent share transaction occurred.
- It can be either real-time (immediate) or delayed (e.g., by 15-20 minutes).
Why It Matters
- For traders: the bid/ask spread, volume and real-time movement tell you about liquidity and execution risk.
- For long-term investors: the quote helps you situate valuation metrics (P/E, market cap) and compare companies in a sector.
- For all: it gives you an objective starting point for deeper analysis—it’s the baseline price plus context.
Core Components of a Stock Quote – Explained
Below are the key fields you’ll typically encounter in a quote, and how to interpret them.
| Field | What It Means | Why It’s Useful | Typical Pitfalls |
|---|---|---|---|
| Ticker Symbol | Unique letters/numbers identifying the company/security. | Essential to locate the correct security; distinguishes classes. | Mistaking one class for another (e.g., GOOG vs GOOGL). |
| Bid Price | Highest price buyers are currently willing to pay. | Signals demand; narrower bid-ask indicates higher liquidity. | Bid may be thin (few shares) or stale. |
| Ask Price | Lowest price sellers are currently willing to accept. | Shows supply; a wide spread means lower trading activity / higher cost to enter. | Attackers may take advantage of large spreads. |
| Bid-Ask Spread | Difference between ask and bid. | Lower spread = greater liquidity; higher spread = riskier, higher cost. | Ignoring spread can lead to surprise slippage. |
| Last Trade Price / Current Price | The price at which the most recent trade occurred. | Gives you the latest market execution—even though it may have changed. | May not reflect executed orders yet; price may jump. |
| Volume (Shares Traded) | Total shares traded in a given period (e.g., day). | High volume can validate price moves; low volume = less reliable. | Apparent volume may include block trades; beware. |
| Day’s High-Low Range | Highest and lowest price during that trading session. | Provides quick view of volatility and intraday swing potential. | If you look only at current price, you miss how far range has travelled. |
| 52-Week High-Low Range | Highest and lowest price during last 52 weeks. | Gives perspective: is the stock near extreme highs/lows? risk/reward context. | Does not inherently imply “cheap” just because it’s near low. |
| Market Capitalization | Total market value: shares outstanding × share price. | Helps compare size of companies across sectors; big vs small. | Market cap moves with price; size alone isn’t value. |
| P/E Ratio (Price-to-Earnings) | Price divided by earnings per share. | Popular valuation metric; lower may suggest undervalued (within same sector). | P/E alone ignores debt, growth, accounting quirks. |
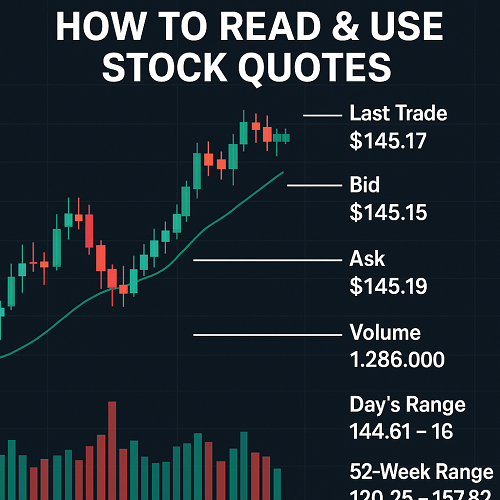
Real-world Example
Imagine a fictional company XYZ Corp (XYZ) displays in your brokerage quote:
- Ticker: XYZ
- Bid: $50.10
- Ask: $50.20
- Last Trade: $50.15
- Volume (today): 1,000,000 shares
- Day’s range: $49.80 – $50.40
- 52-week range: $40.00 – $60.00
- Market Cap: US$2 billion
- P/E Ratio: 18
From that you learn:
- Tight spread ($0.10) → good liquidity.
- Last trade sits near the top of today’s range → possible bullish momentum.
- 52-week high is $60 → still 20% room before year-high if that matters.
- P/E of 18 may be reasonable depending on peers.
Beyond the Basics: Advanced Quote Features & Data
For active traders or analysts, you’ll want to go beyond the standard quote fields and understand advanced metrics and subtleties.
Real-time vs Delayed Quotes
Many free websites provide quotes delayed by 15–20 minutes or more. For example, Investopedia notes that delays can significantly impact trading decisions.
For day trading, you’ll generally want real-time quotes to avoid slippage or outdated data.
Level 2 / Market Depth / Order Book Data
While a basic quote gives bid and ask price, advanced data shows bid size, ask size, order book depth, and more. For example:
- Bid size = number of shares buyers are willing to buy at the bid price.
- Ask size = number of shares sellers are willing to sell at the ask price.
Understanding these gives insight into supply/demand pressure.
Liquidity, Spread & Slippage
A narrow bid-ask spread plus high volume generally means you can execute large trades with minimal impact. Conversely, wide spreads and low liquidity increase cost of entry/exit and risk.
After-Hours Quotes & Extended Trading
Many stocks trade outside regular market hours—pre-market or after-hours. These quotes show where the stock might open next day or how it reacts to news. Basic quote pages may or may not include this.
Composite Metrics & Derived Indicators
Some quote services show additional metrics such as:
- Beta (volatility compared to market)
- Dividend yield
- EPS (earnings per share)
- Forecast earnings
- Analyst consensus ratings
These help round out the view of valuation + risk.
How to Use Stock Quotes to Make Better Investment/Trading Decisions
Here are actionable strategies for different investor types:
For Long-Term Investors
- Use the 52-week range + market cap + P/E to compare companies in same sector.
- If a stock is close to its 52-week low but fundamentals are solid (earnings growing, strong balance sheet), this may signal value.
- Watch volume trends: declining volume over time may suggest weakening interest.
- Use bid-ask spread and liquidity to ensure you won’t be stuck down the line.
For Active/Day Traders
- Monitor real-time bid/ask sizes, spread changes and order book shifts (Level 2).
- Use intraday high-low to gauge breakout potential or reversal points.
- Pay attention to sudden jumps in volume or narrowing spreads—that may signal institutional activity or news.
- Use quotes in conjunction with technical indicators (moving averages, RSI, MACD) to time entries/exits (see technical analysis sources).
For Momentum & News-Driven Traders
- After earnings or big news, check the last trade price relative to pre-market/after-hours quote.
- Evaluate whether the spread remains tight—if large spread opens after news, risk of whipsaw is higher.
- Volume spike + narrowing spread often confirms breakout authenticity; widening spread may suggest move isn’t supported.
Risk Management via Quote Data
- A thin bid size (few shares) may indicate weak support and higher risk of price collapse if sellers come in.
- A stock trading at the top of its 52-week range with high P/E might have less upside—quotes help signal when to be cautious.
- If the volume is dropping while the bid-ask spread is widening, you may be entering an illiquid situation.
Common Mistakes & Misinterpretations
- Mistaking delayed quotes for “live” quotes—leading to poor timing decisions.
- Ignoring bid-ask spread: even if price looks good, you might pay more or sell for less because of wide spread.
- Comparing companies across different sectors using raw P/E without context.
- Ignoring liquidity: high P/E + low volume stocks can be value traps.
- Over-reading the 52-week range: being near a low doesn’t guarantee recovery.
- Focusing on last trade price only and skipping volume / market depth info.
Tools & Platforms to Access Stock Quotes
A few widely-used sources:
- Brokerage platforms (many provide real-time quotes, charts and historical data).
- Free websites offering delayed quotes (sufficient for long-term investors).
- Dedicated quote services offering Level 2 data for traders.
- Mobile apps that provide push alerts when a quote moves beyond selected thresholds.
Make sure you check: whether the quote is real-time or delayed; whether it includes after-hours; what data depth is available (bid-ask size, order book).
Summary & Key Takeaways
- A stock quote is your gateway to market sentiment, pricing, liquidity and valuation condensed into one view.
- Whether you’re an investor or trader, reading quotes well improves your decision-making.
- Go beyond the basic data—incorporate spread, volume, order book depth and context.
- Use quotes not just to see the market, but to act in it.
- Stay aware of data limitations (delayed feeds, low liquidity) and use quotes in conjunction with broader analysis (fundamentals, technicals, news).
Suggested Internal Links (If on your site)
- How to Read Stock Charts (link to your article)
- Fundamental Analysis Basics: P/E Ratio, Market Cap & More
- Beginner’s Guide to Day Trading: Tools & Tactics
- Real-Time vs Delayed Market Data: What You Need to Know
Suggested External References
- Investopedia – “Understanding a Stock Quote”
- StockBrokerReview – “How to Read & Interpret Stock Quotes”
- NerdWallet – “How to Interpret Stock Charts & Data”
Final Steps for SEO Optimisation
- Use H1 for the title; H2/H3 for the sub-sections (1, 2, 3, …).
- Ensure the keyword “how to read stock quotes” appears in first 100 words and in subtitles.
- Include bullet lists & tables (as above) for scan-ability.
- Add around 1500–2500 words (the article above covers structure but may need expansion with examples, charts, images).
- Include images/screenshots of real stock quotes (with overlay arrows pointing to fields), alt text using keywords.
- Create a table of contents (linked) to enhance UX.
- Provide a conclusion with a call-to-action (e.g., “Bookmark this guide, share with peers, subscribe for alerts”, etc.).
- Add schema markup (Article type) if possible on your site.
- Ensure mobile-friendly formatting: short paragraphs, heading hierarchies, mobile load speed.
 XAUT-USD
 AMD
AMD JNJ
JNJ MARA
MARA SHOP
SHOP UNH
UNH BULL
BULL EURUSD=X
 CL=F
CL=F