
Why the U.S. Stock Market Still Rules the World
The U.S. stock market is the global benchmark for liquidity, transparency, and innovation. It’s where trillions of dollars move daily across exchanges like the NYSE and NASDAQ, where the world’s largest companies—from Apple to Nvidia—shape not only portfolios but economies.
Whether you’re a seasoned trader or a beginner stepping into equities for the first time, understanding how to trade U.S. stocks efficiently in 2025 and beyond is a must. This guide combines technical, fundamental, and macroeconomic frameworks—backed by real trading strategies—to help you master U.S. markets in a data-driven way.
Understanding the Structure of the U.S. Stock Market
Major Exchanges
- New York Stock Exchange (NYSE): The oldest and largest, known for blue chips and established corporations.
- NASDAQ: Technology-driven, home to innovation-focused companies.
- AMEX & OTC Markets: Smaller exchanges where penny stocks and ETFs often trade.
Market Hours
- Regular Trading: 9:30 a.m. – 4:00 p.m. (EST)
- Pre-Market: 4:00 a.m. – 9:30 a.m.
- After-Hours: 4:00 p.m. – 8:00 p.m.
Extended hours can offer opportunity—but also thin liquidity and increased spreads.
Indices to Watch
- S&P 500: The pulse of the U.S. economy.
- NASDAQ 100: Tech-driven and growth-sensitive.
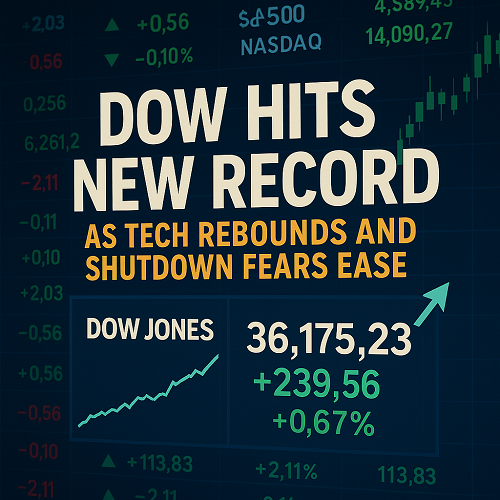
- Dow Jones Industrial Average: Legacy blue-chip benchmark.
- Russell 2000: Small-cap exposure for diversification.
Monitoring index movement is crucial because sector and index rotation often dictate where capital flows next.
Macro Forces That Move the Market
Successful traders don’t only analyze charts—they interpret macro context.
The main drivers include:
Federal Reserve Policy
Interest rate adjustments directly affect valuations.
- Rising rates: Compress P/E multiples, hurt growth stocks.
- Falling rates: Boost liquidity and speculative sectors.
Inflation & GDP Growth
- High inflation → cost pressures → reduced consumer spending.
- Strong GDP → increased earnings expectations.
Intermarket Relationships
- Bonds: Yields compete with equities for capital.
- Commodities: Rising oil or gold often signals inflationary trends.
- Currency (USD): A strong dollar can weaken multinational earnings.
- Crypto: Increasingly correlated in risk-on/risk-off cycles.
Understanding these correlations turns macro awareness into trading edge.
Fundamental Analysis: Evaluating Company Health
Key Metrics
- Earnings per Share (EPS): Profitability per share.
- Price/Earnings Ratio (P/E): Relative valuation measure.
- Debt-to-Equity Ratio: Balance sheet strength.
- Free Cash Flow (FCF): Real liquidity after expenses.
- Return on Equity (ROE): Efficiency of shareholder capital.
Screening for Winners
Modern screeners like Finviz, TradingView, or MarketSmith let you filter stocks by:
- Market capitalization
- EPS growth
- PEG ratio
- Institutional ownership
A blend of quantitative filtering and qualitative research (management, sector position) builds conviction.
Technical Analysis: Reading Market Psychology in Charts
Core Concepts
- Trends: Identify higher highs/lows or lower highs/lows.
- Support & Resistance: Institutional buying/selling zones.
- Volume: Confirms conviction behind moves.
- Patterns: Flags, triangles, double tops, etc.
- Indicators:
- Moving Averages (MA) for trend confirmation.
- RSI for momentum & overbought/oversold readings.
- MACD for signal line crossovers.
- VWAP for intraday reference points.
Multi-Timeframe Analysis
- Weekly: Structural bias
- Daily: Swing setups
- 4H/1H: Execution precision
Always align lower-timeframe entries with higher-timeframe trend direction.
Strategy Frameworks That Work in 2025
A. Breakout Strategy
- Identify consolidation ranges with declining volume.
- Enter on volume-confirmed breakout above resistance.
- Stop loss just below the breakout candle.
Best for: Momentum stocks in strong uptrends (e.g., tech, biotech).
B. Pullback (Mean Reversion) Strategy
- Wait for retracement to 20- or 50-day MA in an existing trend.
- Enter when price shows reversal candle pattern (hammer, engulfing).
- Stop loss below retracement low.
C. Sector Rotation Strategy
- Track ETF leaders: XLK (Tech), XLF (Finance), XLE (Energy).
- Capital moves cyclically across sectors.
- Buy outperforming sectors early in rotation phase.
D. Pairs Trading
- Go long one stock and short another in the same sector (e.g., MSFT vs. AAPL) to capture relative strength.
E. Algorithmic & Quantitative Approaches
- Combine moving averages, volatility filters, and backtesting in Python.
- Automate execution using APIs and real-time feeds.
Risk Management: Protecting Capital Like a Pro
Capital preservation is the cornerstone of longevity.
Position Sizing
Risk only 1–2% of total capital per trade.
Formula:Position Size = (Account Equity × Risk %) / (Stop Loss Distance)
Stop Loss & Take Profit
Always pre-define exits.
Use ATR (Average True Range) to adapt stops dynamically to volatility.
Diversification & Correlation
Avoid overexposure to similar assets—holding AAPL, NVDA, and MSFT is not diversification.
Mix sector and volatility profiles.
Emotional Discipline
Use journaling and automation to remove impulsive decision-making.
Top Tools, Platforms & Data Feeds for U.S. Stock Traders
| Category | Examples | Why It Matters |
|---|---|---|
| Charting & Analysis | TradingView, TrendSpider, ThinkorSwim | Visualization, alerts, strategy testing |
| Brokerages | Interactive Brokers, TD Ameritrade, Webull | Execution quality, API access |
| Data Providers | Alpha Vantage, Polygon.io, Yahoo Finance | Backtesting, real-time feeds |
| News & Sentiment | Benzinga, MarketWatch, Finviz News | Event-driven trading opportunities |
Pair your tools: for instance, analyze on TradingView, execute via IBKR, and log trades automatically in Notion or Excel.
Cross-Market Trading: Stocks, Forex & Crypto Together
The new generation of traders thrives on cross-asset awareness.
- Stocks vs. Crypto: Both respond to liquidity cycles. Risk-on phases benefit both; tightening policy hurts both.
- Stocks vs. Forex: USD strength often pressures U.S. multinationals but benefits exporters.
- Correlation Trading: Use DXY (U.S. Dollar Index) and BTC as leading indicators for risk sentiment.
Smart traders treat markets as interconnected ecosystems, not silos.
Example Trade Breakdown
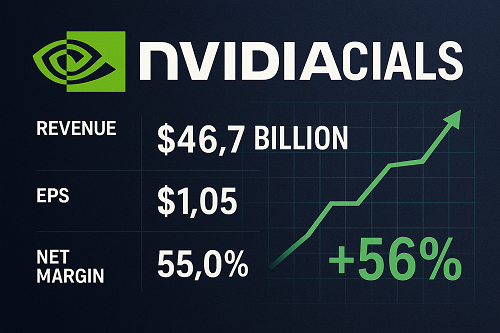
Case: Nvidia (NVDA) – 2024 Q4
- Setup: Strong uptrend; pullback to 20-day MA on light volume.
- Entry: Breakout candle on high volume above prior resistance.
- Stop: Below prior swing low.
- Exit: Partial at +10%, remainder trailed via 10-day MA.
- Result: +18% in 15 days (swing trade).
- Lesson: Combining technicals with AI sector tailwind yielded high-probability setup.
Common Mistakes to Avoid
- Overtrading: Quality > Quantity.
- Ignoring Risk: No stop = eventual wipeout.
- Following Hype: Trade plan beats social media chatter.
- Neglecting Macro Data: Rates and inflation always matter.
- FOMO & Revenge Trading: The psychology trap of retail traders.
Future Trends for 2025–2026
- AI & Automation: Algorithmic retail adoption will surge.
- Fractional Trading Expansion: Smaller investors gain direct U.S. access.
- Tokenization: Equities on blockchain rails.
- Green & Energy Transition: Capital flow toward renewables and efficiency tech.
- Volatility Normalization: Post-2024 election environment may tighten liquidity.
Action Plan: Mastering U.S. Stock Trading in 30 Days
Week 1: Study fundamentals of 20 top S&P 500 companies.
Week 2: Practice chart analysis; journal daily.
Week 3: Paper trade with defined strategy (e.g., breakout).
Week 4: Execute 3–5 small-risk trades, review, and refine.
Track performance, adjust risk rules, and gradually scale.
FAQs
Can international traders buy U.S. stocks?
Yes, via global brokers like Interactive Brokers or eToro, though tax treaties may apply.
What’s the minimum capital to start?
As little as $500–$1,000 with fractional shares, though $10K+ allows proper diversification.
Is day trading profitable?
It can be—but only with strict discipline, backtesting, and risk control.
Which sectors are strong in 2025?
AI, semiconductors, energy infrastructure, and healthcare innovation lead the momentum list.
Conclusion
The U.S. stock market remains a global performance benchmark—a playground for institutions and individuals alike. But to thrive, traders must evolve beyond basic charts and newsfeeds.
Integrating macro insight, multi-asset awareness, and robust risk management is what separates the consistently profitable from the rest.
The tools are available. The data is accessible. What matters is discipline, preparation, and continuous refinement.
Start today—one trade, one insight, one disciplined decision at a time.
 XAUT-USD
 AMD
AMD JNJ
JNJ MARA
MARA SHOP
SHOP UNH
UNH BULL
BULL EURUSD=X
 CL=F
CL=F