
China’s stock markets, including the SSE Composite Index, remain among the most watched in the global financial ecosystem. From policy shifts in Beijing to capital flows from domestic and foreign investors, movements in Chinese equities carry outsized signals about global risk appetite, economic rebalancing, and sectoral rotation.
While pages like TradingEconomics offer valuable snapshots, our goal here is to provide a comprehensive, forward-looking, deeply analytical resource that helps traders and long-term investors understand the structural drivers, risk factors, trade strategies, and valuation dynamics at play.
In this article, you’ll find:
- Recent performance and statistical context
- Key market structure, indices, and how to track them
- Macro and political catalysts
- Sectoral themes and rotation stories
- Risk assessment matrix
- Tactical strategies for trading or investing China equities
- A forward outlook and scenario framework
Let’s begin by situating where the market stands as of late 2025.
Current Market Snapshot & Historical Context
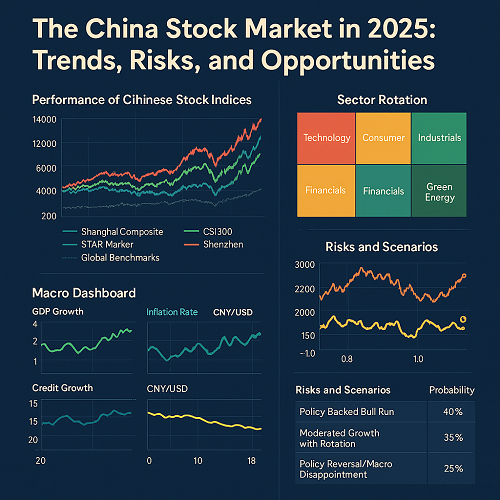
Performance Overview
- The Shanghai Composite Index recently traded around 3,830 points, reflecting a 0.22 % gain on September 22, 2025, per trading on a contract for difference (CFD).
- Over the past month, the index was down ~1.42 %, but remains ≈ 39.3 % higher year-over-year.
- On a broader scale, Chinese stock indices have outpaced many global peers in 2025, fueled by policy support and investor inflows.
These numbers mirror the bullish sentiment around Chinese equities but also mask choppy shorter-term volatility and sector-level divergences.
Indices & Benchmarks: What to Follow
For those tracking or trading Chinese equities, here are the core indices to monitor:
| Index | Exchanges / Coverage | Why It Matters |
|---|---|---|
| Shanghai Composite (SSE Composite) | Shanghai Stock Exchange | Broadest gauge of all listed stocks on SSE. |
| CSI 300 Index | Top 300 stocks on Shanghai + Shenzhen | Blue-chip proxy often used by funds; analogous to S&P 500 for China. |
| STAR Market (Sci-Tech Board) | A science & tech–oriented board under SSE | Meant to foster innovation firms (China’s Nasdaq analogue) |
| Shenzhen Composite | Shenzhen Stock Exchange | More small- and mid-cap, more volatile and theme-driven |
Tracking multiple indices gives insight into breadth, leadership, and market sentiment across capitalizations and sectors.
Structural Features & Market Mechanics
- Dual exchanges with restricted access: Onshore markets (Shanghai, Shenzhen, STAR, etc.) have capital controls. Foreign participation is enabled via programs like Stock Connect and Qualified Foreign Institutional Investor (QFII) / RQFII regimes.
- Large state / institutional ownership: Many listed firms are partially state-owned, and policy direction can affect valuations more acutely than in fully free markets.
- Higher volatility & regulatory intervention risk: The Chinese government has intervened historically (e.g. banning IPOs, halting trading, directing state funds).
- Margin debt and leverage cycles: The market has seen spikes in margin trading (a warning flag for excesses). Some recent reports suggest margin financing recently surpassed levels seen in the 2015 bubble.
Macro & Political Drivers
Understanding what moves China’s equity markets requires connecting macro, monetary, fiscal, and geopolitical forces. Below are the salient drivers in 2025.
Economic Growth & Structural Trends
- China’s growth continues to slow relative to the “old normal.” While it is still one of the fastest-growing major economies, growth of 4–5 % is widely expected.
- The property sector, once a core growth engine, has weakened significantly, reducing local government finances and creating drag on related industries.
- Aggressive infrastructure and technology investment is becoming a more central growth pillar under Beijing’s direction.
- Weak consumer demand and cautious corporate capex remain headwinds, particularly in non-tech sectors.
Monetary, Credit & Liquidity Conditions
- The People’s Bank of China (PBoC) has navigated between maintaining liquidity and combating inflation or financial imbalances.
- Low interest rates and yield compression in fixed income have pushed institutional and retail capital toward equities.
- Credit growth, local government debt, and shadow banking risks persist, constraining how far loose policy can go.
Fiscal & Policy Support
- Stimulus efforts via infrastructure, subsidies for innovation, and targeted fiscal injections into lagging regions or sectors.
- COS (China’s sovereign funds) or state-owned entity flows may be directed to “support markets” in turbulent times.
- Policies encouraging insurance companies, pension funds, and mutual funds to expand equity allocations. Reports suggest insurers have increased equity exposure by ~26 %.
Geopolitics, Trade & External Risks
- U.S.–China tensions, especially around tariffs, export controls, and sanctions risk, remain an overhang.
- Currency fluctuations (CNY vs USD) influence foreign inflows/outflows and valuation adjustments.
- Global interest rate cycles: U.S. Fed policy shifts often ripple into China via capital flows and relative yield curves.
- Commodity price volatility (e.g. for industrial metals) affects upstream Chinese industry earnings.
Themes & Sectoral Rotation
To beat broader indices, many investors focus on themes and structural rotations. Here are the most prominent ones in 2025.
Technology, AI & Semiconductors
- Chinese AI, semiconductor, robotics, industrial automation, and clean energy firms are among the most sought-after names.
- Firms in “new economy” sectors often command premium valuations, and policy support is frequently channeled there.
- The “STAR market” is a key incubator for these innovation firms.
Consumer & Domestic Consumption
- As China seeks to pivot from export-driven growth toward consumption-led expansion, consumer, healthcare, e-commerce, and services sectors gain importance.
- But consumer confidence remains relatively fragile, and high household savings rates may mean slower cyclicality in consumer uptake.
Industrials, Materials & Infrastructure
- Beneficiaries of stimulus spending and infrastructure projects (steel, construction, machinery, logistics).
- However, they are vulnerable to cyclical downturns and overcapacity issues historically associated with Chinese heavy industries.
Financials & Real Estate Exposure
- Financials (banks, brokers, insurers) play a critical role as lenders and capital allocators. Their performance is tied to credit cycles, NPL (non-performing loan) levels, and interest margins.
- Real estate exposure is a double-edged sword: many companies and local governments are implicated, so sector stress can bleed into broader financial markets.
Clean Energy, ESG, and Green Technologies
- China is pushing “dual carbon” goals (carbon peak by 2030, neutrality by 2060), directing incentives into clean energy, EV (electric vehicle) batteries, solar, wind, and related value chains.
- ESG-focused investors may find opportunities among Chinese firms that adopt stronger environmental and governance standards.
Risk Assessment & Warning Signals
No market narrative is complete without rigorously assessing risks. Below is a risk matrix and signs to monitor.
Key Risks
- Regulatory / policy risk: abrupt changes in rules, breakups of “too powerful” firms, clampdowns on sectors (e.g., tech in 2021).
- Margin blowups & forced deleveraging: if margin debt peaks and liquidity tightens, sharp reversals could follow.
- Earnings disappointments: inflated valuations in growth sectors require strong execution; weakness could lead to sharp re-rating.
- Weak macro data / recession fears: falloff in consumption or exports could cascade into credit stress.
- Capital flight / currency pressures: sudden outflows may force policy tightening.
- Geopolitical shock: escalation in U.S.–China tension or trade measures could spook global investors.
Signals to Watch
- Margin balances & leverage indicators — track market-wide leverage.
- Credit spreads / bond yields — widening spreads may hint at stress.
- Foreign net flows via Stock Connect / QFII.
- Policy communications from PBoC, China Securities Regulatory Commission (CSRC), or central leadership.
- Sector rotation and breadth metrics — if only a few mega-cap names rally and breadth weakens, risk of reversal is higher.
- Leading macro indicators: PMI, industrial production, consumer data, property sales.
Tactical Strategies for Traders & Investors
Here are actionable strategies adapted to various time horizons and risk tolerances.
For Short-Term Traders (Days to Weeks)
- Momentum breakout plays in tech, AI, robotics — ride strong sector momentum but set tight stop losses.
- Pair trades / relative strength: long outperforming sector, short weak sector (e.g. long tech vs short materials).
- Event trades: policy announcements, quarterly earnings, macro releases — trade the reaction.
- Volatility capture: buy volatility instruments or straddles around high-uncertainty events (e.g. CSRC announcements).
For Medium-Term Investors (Weeks to Months)
- Thematic allocation: overweight AI, semiconductors, green tech, and electric vehicles.
- Core satellite approach: hold blue-chip or index-tracking core, overweight “high conviction” thematic picks as satellites.
- Use dollar-cost averaging to mitigate entry timing risks given high volatility.
- Hedge via index or futures if you have concentrated positions.
For Long-Term Investors (Quarters to Years)
- Focus on structural growth themes: clean energy, high-end manufacturing, domestic consumption, healthcare, AI.
- Invest in solid balance-sheet names with governance, strong cash flows, defensible moats.
- Expect cyclicality — position for drawdowns, have reserve capital, and be prepared to average down or rebalance.
- Consider exchange-traded funds (ETFs) or indices (e.g. CSI 300, China A-shares via Stock Connect) for diversified exposure.
Valuation, Multiples & Comparative Benchmarks
Valuation is a critical counterbalance to theme-driven optimism.
- Chinese growth stocks trade at premium multiples but also face higher risk.
- Compare P/E, P/B, and PEG ratios against Asian peers, U.S. growth stocks, and local bond yields.
- Adjust valuation expectations downward in sectors exposed to regulation or high leverage.
- Use discounted cash flow (DCF) only for firms with reasonably predictable earnings; for high-growth firms, relative valuation and scenario analyses may be more informative.
- Monitor dividend yields and shareholder return policies — many Chinese firms prioritize reinvestment.
Forward Outlook & Scenarios
Here’s a scenario framework to watch, with probability estimates (subjective) and implications.
Scenario A: “Policy-Backed Bull Run” (~40 % probability)
- Beijing doubles down on stimulus, relaxes leverage constraints, boosts credit, and encourages equity investment via institutional mandates.
- Equity inflows accelerate, valuations expand, leading to 20–30 % further upside.
- Risk is this run overshoots fundamentals and fosters bubbles in sub-sectors.
Scenario B: “Moderated Growth with Rotation” (~35 %)
- Growth remains steady at 4–5 %. The market advances, but with rotation across themes and occasional pullbacks.
- Investors gradually reallocate earnings from mega-cap themes to consumer, healthcare, and green plays.
- Consolidation and selective overweights prevail.
Scenario C: “Policy Reversal / Macro Disappointment” (~25 %)
- Economic data weakens, credit stresses build, and the government shifts to austerity.
- Exit by foreign and domestic institutional investors accelerates, triggering sharp multiple compressions.
- A 20–30 % drawdown is not unlikely, especially if margin deleveraging is forced.
Your optimal exposure depends on your conviction, time horizon, and risk appetite. Risk management and capital allocation discipline will be key.
How to Use & Track This Analysis
- Update regularly: This is a snapshot; macro, data releases, and policy will evolve.
- Layer in visuals: charts of margin debt, flows, sector performance, valuation dispersion.
- Link external data sources: e.g. Wind, Bloomberg, Wind Financial Terminal, official Chinese stats.
- Incorporate comparative frameworks: e.g. how China equity risk premia compare to U.S. equities, EM indices, or bond yields.
Conclusion
China’s stock markets in 2025 offer a mix of opportunity and risk. While policy tailwinds, retail/institutional capital shifts, and thematic innovation (AI, clean energy, semiconductors) offer strong upside, structural challenges—credit stress, real estate weakness, regulatory unpredictability—demand caution and selective exposure.
Traders and investors who can read the macro signals, manage risk tightly, and pivot between themes are most likely to outperform. Use our scenario framework, monitor leading indicators and valuations, and always embed downside protection in your approach.
 XAUT-USD
 AMD
AMD JNJ
JNJ MARA
MARA SHOP
SHOP UNH
UNH BULL
BULL EURUSD=X
 CL=F
CL=F