
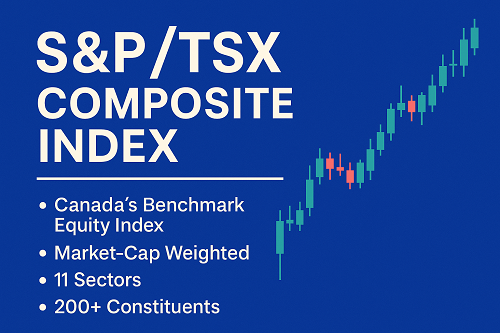
The S&P/TSX Composite Index (often simply “TSX Composite” or “S&P/TSX”) is Canada’s flagship equity benchmark, designed to represent the broad performance of publicly traded Canadian companies. As of recent data, it covers roughly 70% (or more) of the total market capitalization of the Toronto Stock Exchange (TSX).
Key facts at a glance:
- Operator / Provider: S&P Dow Jones Indices (Standard & Poor’s)
- Launch / Replacement Date: May 1, 2002 (replacing the earlier TSE 300 index)
- Number of Constituents: Typically in the 200–250 range, though this fluctuates over time. wiki+1
- Weighting Methodology: Capitalization weighted (with capping constraints)
- Sectors Covered: Eleven major sectors, including Financials, Energy, Materials, Industrials, Technology, Consumer Discretionary, Utilities, etc.
- Home Symbol: ^GSPTSE on many financial data platforms
This index is widely used as the benchmark for Canadian equities, a barometer of investor sentiment in Canadian markets, and a reference for fund managers, institutional portfolios, and domestic/international investors seeking exposure to Canada.
Historical Evolution
Pre-2002: The TSE 300 Era
Before 2002, the main broad index for Canadian equities was the TSE 300 (launched earlier, covering 300 companies). Over time, the TSE 300 evolved, and adjustments were made to methodology, sector inclusion, and weight constraints.
Transition to S&P/TSX Composite
On May 1, 2002, the S&P/TSX Composite officially replaced the TSE 300 as the principal benchmark. The rebranding also brought in enhanced governance, methodology refinement (via S&P), and alignment with global index standards.
Structural Changes & Rebalancing
Over time, the index undergoes quarterly rebalancing to add or remove securities, adjust weights, and ensure compliance with liquidity and market cap thresholds.
Notably, in 2014–2015, the index saw a marked shift: several resource/commodity-oriented stocks were removed, while more tech, consumer, and diversified companies were added — signaling Canada’s evolving economic structure.
Composition & Eligibility Criteria
Not every stock on the TSX can appear in the Composite. There are strict rules to maintain representativeness, liquidity, and manage concentration risk.
Eligibility Criteria
- Market Capitalization
- A stock must represent a minimum weight (e.g. 0.05% of the index)
- The stock must maintain a minimum average price (usually ≥ CAD 1) over the past three months and on the last three trading days of the month prior to review
- Liquidity Requirements
- The company’s trading volume (in dollar terms and number of trades) must exceed a certain threshold relative to the total eligible universe (e.g. 0.025% of total trading volume)
- This helps ensure that the stocks included are sufficiently tradable and not too illiquid
- Domicile / Listing Requirements
- The stock must be listed on the Toronto Stock Exchange
- It must be incorporated under Canadian laws (or have sufficient Canadian presence)
- Capping / Concentration Limits
- To prevent dominance by a single company, weights are capped (historically ~10%, sometimes 15% depending on rules) for value, volume, and transactions.
- Some sectors may have sub-index caps to avoid overexposure to, say, energy or materials
- Review & Rebalancing
- The index committee reviews constituents and weights quarterly (and sometimes annually) to ensure continued compliance.
What the Composite Represents
Because of these rules, the Composite index captures “most” (often 70–95%) of market capitalization of the TSX, but only via stocks meeting quality, size, and liquidity thresholds. Investopedia+1
Index Calculation & Weighting Methodology
Market-Cap Weighted Scheme
The index is calculated via market capitalization weighting, meaning each constituent’s weight is proportional to its share of total market cap (subject to caps). Large companies thus have an outsized influence on index moves.
Free-Float Adjustments
To more accurately reflect investable market, shares not freely tradable (insiders, locked-up shares, government holdings) may be excluded via free-float adjustments. This reduces distortions from shares that exist but don’t contribute to market dynamics. (This is standard practice in many S&P indices.)
Capping and Constraints
- Single-stock caps: Prevent any one company from exceeding a certain percentage (e.g. 10 or 15%)
- Sector or group caps: Some sectors may have built-in over-concentration limits to avoid dominance by one industry
- Volume/transaction caps: To prevent excessively illiquid stocks from getting outsized influence
Divisor and Adjustments
A divisor is used to normalize the index so that corporate actions (stock splits, mergers, dividends, issuance) do not artificially alter the index level. When events such as mergers, spin-offs, or new share issuance occur, the divisor is adjusted to maintain continuity.
Rebalancing / Reconstitution
- Occurs typically quarterly, sometimes semi-annually or annually
- New candidates are considered; non-compliant stocks are removed
- The committee may adjust weights or make changes to capping
- Reviews are announced in advance to allow funds to adjust
Sectoral Breakdown & Trends
Sector Weightings
The S&P/TSX Composite features 11 standard sectors (based on GICS or similar classification), including:
- Financials
- Energy
- Materials
- Industrials
- Information Technology
- Consumer Discretionary
- Consumer Staples
- Utilities
- Health Care
- Communication Services
- Real Estate
Among these, Financials, Energy, Materials tend to be heavy contributors historically, reflecting Canada’s resource-based economy.
Over time, though, we have seen rising representation of Technology, decreased weighting in pure commodity plays, and more diversified sectors in the index reflecting the structural shifts in Canada’s economy.
Trends & Shifts Over Time
- In earlier decades, commodity, natural resources, energy, and mining-related companies held large weight.
- The 2014–2015 reshuffle reduced dominance of resource companies, expanding representation of consumer, technology, and diversified firms.
- The growth of financial institutions also ensures that Banks, Insurance, and Asset Management firms are core drivers
- In recent years, concerns about resource commodity cycles, environmental policy, and energy transition have impacted material/energy sector weighting
Understanding sector trends is crucial — when energy and materials rally, they can disproportionately move the index.
Performance & Return History
Long-Term Returns
Because the Composite has now been backcast with data (via TSE-based indices), performance tables exist going back decades. For example:
- From 2005–2024, there have been years with double-digit gains, some negative years (e.g., 2008, 2015), and some volatility around resource cycles.
- In recent years, the index has broken new all-time highs (e.g. closing high near 29,407.89 in September 2025)
- The compound annual growth rate (CAGR) over multi-decade horizons is subject to market regime; though not as high as some high-growth sectors in the U.S., it offers a solid base tied to Canada’s economic output
Volatility & Drawdowns
- Because of concentration in resource sectors, the index is somewhat more cyclical and can experience sharp drawdowns during commodity downturns or global slowdowns
- For example, in market corrections, energy and materials decline can drag the index heavily
- Compared to broader global indices, volatility is moderate but not insignificant
Comparisons to Benchmarks
- The TSX Composite tends to lag in massive bull markets driven by U.S. tech (since it has lower weight in mega tech names)
- In resource bull cycles, it sometimes outpaces more diversified global indices
- Relative to U.S. indices (e.g. S&P 500), returns are more tied to resource cycles and domestic Canadian economic growth
Recent Performance Snapshots
- In 2025, the TSX Composite has reached fresh highs, fueled in part by stronger gold/commodity prices, favorable central bank policies, and domestic investor confidence
- Over the past year, its performance has significantly outpaced or lagged depending on commodity cycles and currency movements
Investors should analyze risk-adjusted returns, correlation to global markets, and currency effects when holding TSX Composite exposure.
Comparisons: TSX Composite vs Global Indices
Comparing the TSX Composite to major global indices helps gauge its relative strengths, weaknesses, and portfolio role.
| Feature | TSX Composite | S&P 500 (U.S.) | MSCI World / MSCI ACWI |
|---|---|---|---|
| Sector Concentration | High weight in Energy, Materials, Financials | Technology, Communication, Consumer | More diversified |
| Tech Exposure | Lower | Very high | Moderate |
| Resource Sensitivity | Strong (commodities, carbon, energy trends) | Less direct | Varies |
| Currency Risk | Canadian-dollar (CAD) exposure | USD native | Mixed currency basket |
| Growth vs Value Tilt | More value/resource tilt | Blend/growth | Blend |
| Correlation | Moderately correlated with U.S./global markets | Benchmark global driver | Global benchmark |
Because of its resource tilt, the TSX can act as a complementary diversifier in a global portfolio — it tends to perform better when commodity prices are rising, and lag when global tech rallies.
How to Invest & Gain Exposure
For most investors, direct replication (buying all constituent stocks) is impractical. Here are practical vehicles:
1. ETFs / Index Funds
Some funds track all or parts of the TSX Composite (or near equivalents):
- iShares S&P/TSX Capped Composite Index ETF (XIC)
- BMO S&P/TSX Capped Composite Index ETF (ZCN)
- Combined use of iShares S&P/TSX Completion Index + S&P/TSX 60 can mimic Composite exposure (though not perfect)
- These ETFs impose their own capping (e.g. 10%) so that no single stock dominates
2. Mutual Funds & Index Funds
Canadian equity index mutual funds often replicate the Composite or a close proxy. For example:
- Scotia Canadian Equity Index Fund (tracks TSX Composite exposure)
3. Direct Stocks / Basket Approach
Advanced investors or institutional accounts can hold a basket of high-weight constituents (e.g. banks, energy majors) to approximate TSX movement. But this introduces tracking error and concentration risk.
4. Derivatives / Futures / Options
Some derivative products or futures contracts may reference the TSX Composite, allowing leveraged or hedged exposure. (Availability depends on markets and derivatives desks.)
Things to Consider When Investing:
- Expense Ratio / Fees: ETFs carry management fees, so choose low-cost options
- Tracking Error: The fund may deviate slightly from Composite due to capping, rebalancing, or fund holdings
- Currency Exposure: If investing from outside Canada, currency risk (CAD vs USD, EUR, etc.) applies
- Taxation: Dividends, capital gains, and withholding taxes differ based on domicile (Canadian vs foreign)
- Rebalancing & Turnover: Index changes cause fund turnover, which can incur costs
Risks, Limitations & Critiques
While the TSX Composite is a valuable benchmark, it is not perfect. Some key limitations and risks:
- Resource / Commodity Concentration
- Its higher exposure to energy, materials, mining means it’s more vulnerable to global commodity cycles
- In a prolonged commodity slump, the index often underperforms
- Lower Tech Weight / Missing Mega Tech Exposure
- Compared to U.S. indices, the TSX lacks “mega-cap tech” influence, meaning it can miss big tech-driven upswings
- Concentration Risk
- Even with capping, a few large firms (e.g. big banks, energy companies) can dominate index moves
- Currency / FX Risk
- For non-Canadian investors, CAD fluctuations can erode or boost performance
- Emerging-Market / Small-Cap Underrepresentation
- Many smaller or emerging Canadian companies are excluded, so the Composite may understate growth in emerging sectors
- Rebalancing Effects & Turnover Costs
- Quarterly changes can create tracking error and transaction costs for funds
- Structural Biases
- Because many Canadian companies are resource or financial based, the index may be less diversified across business models
- Regulatory / Political / Environmental Risk
- Canadian energy and natural resources are sensitive to environmental regulation, carbon taxes, indigenous rights, and global climate policy shifts
When using the Composite in a portfolio, these risks must be accounted for, hedged, or balanced with complementary exposures.
Forecasts & Strategic Outlook
Macro & Commodity Outlook
- If commodity prices (oil, metals, minerals) rise, the TSX Composite is likely to benefit disproportionately
- Conversely, in deflationary or low commodity cycles, the index may lag
Interest Rates & Monetary Policy
- Lower interest rates can boost valuations of financial and capital-intensive firms
- If global rates diverge (e.g. U.S. rates vs Canada), the CAD and capital flows may move, influencing TSX returns
Structural Transition & ESG Trends
- Energy transition and ESG mandates may shift weight from fossil fuel-based companies to renewable, tech, or sustainable firms
- Companies must adapt or face regulatory/market headwinds
Global Capital Flows & Correlation
- Increased capital flows into or out of Canada (e.g. via foreign institutional investors) can amplify index movement
- Correlation with U.S./global indices may strengthen during macro/global stress periods
Projected Scenarios
- Commodity Rally Scenario
- TSX Composite outperforms global benchmarks
- Energy, mining, metals lead
- Currency (CAD) may appreciate, further boosting returns for foreign investors
- Global Tech Boom Scenario
- TSX may lag if tech-heavy indices (e.g. Nasdaq) lead
- Underperformance due to lack of mega-cap tech exposure
- Stagnation / Low Growth Scenario
- Moderate returns; strength in financials and stable dividend-paying names
- Volatility may increase, and index may rely on yield firms
From a strategic standpoint, investors may consider combining TSX exposure with global/tech indices to diversify sector risk and capture broader growth trends.
FAQs
Q: What does “Composite” mean in S&P/TSX Composite?
Answer: It denotes a broad, composite index — capturing a large swath of the market (rather than just large caps, or a subset).
Q: How many stocks are in the TSX Composite?
Answer: The number varies, but typically between 200 and 250 constituents, based on eligibility and periodic rebalancing.
Q: How often is the index rebalanced?
Answer: Generally quarterly, with committee reviews for additions/removals.
Q: Can investors buy the “TSX Composite” directly?
Answer: No — but through ETFs, index funds, or derivative products, one can gain exposure.
Q: Why does TSX sometimes lag U.S. indices?
Answer: Because of differences in sector composition (less mega-cap tech), cyclical exposure, and domestic economic drivers.
Q: Does the Composite pay dividends?
Answer: The index itself is price return – but constituent stocks pay dividends. Many ETFs tracking the Composite distribute dividend income to holders.
Conclusion
The S&P/TSX Composite Index is a foundational benchmark for Canadian equity markets — deeply rooted in the resource-rich economy and evolving with structural shifts. For Canadian and international investors alike, it serves as a core exposure to Canada’s public markets, but one must be mindful of its resource tilt, concentration risk, and methodical quirks.
A robust investment strategy often involves combining TSX Composite exposure with global or thematic assets to smooth volatility and capture broader growth. Given structural trends — from energy transition to capital flow shifts — the index may gradually diversify further and respond to new drivers of value.

 XAUT-USD
 AMD
AMD JNJ
JNJ MARA
MARA SHOP
SHOP UNH
UNH BULL
BULL EURUSD=X
 CL=F
CL=F