
The S&P/TSX 60 Index, sometimes abbreviated as SP TSX, is one of Canada’s leading benchmarks for large-cap equities. It tracks top publicly traded firms in Canada, reflecting the performance of major sectors in the Canadian economy. Whether you are an investor, trader, or analyst, understanding its mechanics, composition, strengths, and risks is essential. This guide provides a comprehensive, up-to-date overview to help you use the TSX 60 intelligently.
What Is the S&P/TSX 60?
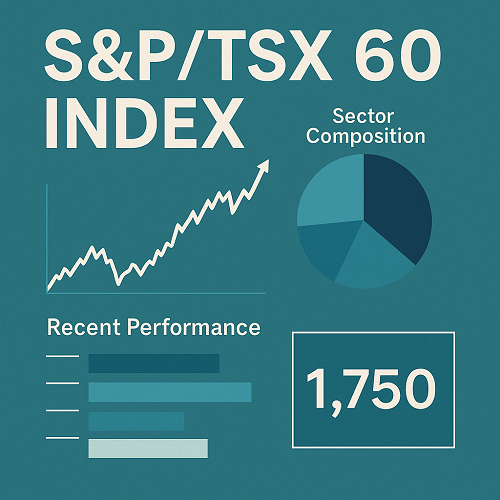
- Definition: The S&P/TSX 60 is a stock index that includes 60 of the largest, most liquid Canadian companies listed on the Toronto Stock Exchange (TSX).
- Purpose: It is designed to measure the large-cap segment of the Canadian equity market, structured to reflect sector weights similar to those in the broader S&P/TSX Composite Index. In short, it offers investors exposure to Canada’s leading firms and major economic sectors.
- History: Launched on December 30, 1998, by the Canadian S&P Index Committee, which is part of S&P Dow Jones Indices.
Methodology & Eligibility
Understanding how the index is constructed is critical, especially for those using it for trading, investments, or benchmarking.
Eligibility Criteria
To be included in the S&P/TSX 60:
- Canadian Domicile
The company must be domiciled in Canada (federal, provincial, or territorial jurisdiction). - Large-Cap Size & Liquidity
Companies must be among those with large market capitalization and have sufficient trading volume/liquidity. Specifically, they must also be constituents of the S&P/TSX Composite Index. - Regular Trading
The stocks should be actively traded (i.e. meet liquidity measures). Companies with too thin trading may be excluded. - Free-Float Market Capitalization
The index uses free-float market cap (i.e. only shares publicly available, excluding large locked-in holdings) when weighting constituents. - Sector Exposure & Balance
While large companies dominate, the index aims to reflect sector weights present in the overall TSX Composite, so that no single sector becomes overly dominant. There are guidelines and often caps to prevent sector overconcentration.
Weighting and Rebalancing
- Market Cap Weighting: Constituents are weighted by free-float market cap, meaning that larger companies have a correspondingly greater impact.
- Periodic Rebalancing: The index is reviewed periodically (quarterly or semi‐annually) to ensure that constituents still meet eligibility, and that sector weights remain representative. Mergers, acquisitions, or delistings can also trigger changes outside regular reviews.
Sector Composition & Key Players
Knowing which sectors and companies dominate the index helps understand risks, opportunities, and correlations.
Major Sectors
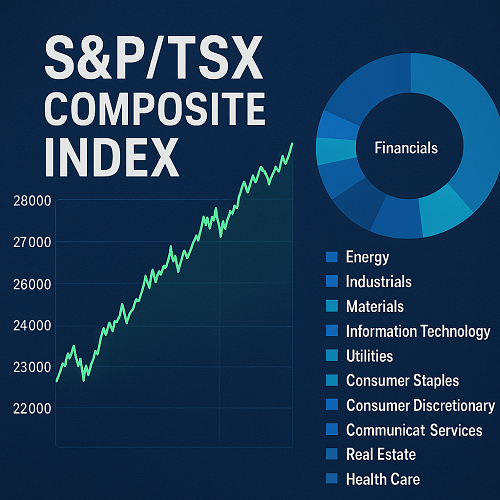
As of the latest data, the S&P/TSX 60 is heavily weighted toward:
| Sector | Approximate Weight |
|---|---|
| Financials | ~ 30-35 % |
| Energy | ~ 18-20 % |
| Industrials | ~ 10-15 % |
| Materials | ~ 10-12 % |
| Information Technology, Utilities, Consumer sectors, Communication services etc. | collectively the remainder, smaller but increasing in relevance. |
Key Constituent Companies
Some of the largest, most influential members are:
- Royal Bank of Canada (RBC) and Toronto-Dominion Bank (TD) – leading financial institutions.
- Shopify – a major tech/digital commerce player.
- Energy majors such as Canadian Natural Resources, Tourmaline Oil, and possibly large integrated energy firms.
- Materials / Mining firms like Barrick, Agnico Eagle.
- Also Utilities, Consumer Discretionary & Communication companies.
Performance & Recent Trends
To understand the TSX 60’s behavior, it’s important to look at its recent performance, volatility, and how macro & sectoral trends have shaped returns.
Recent Performance
- Over the past 250 trading days (≈1 year), the TSX 60 has shown returns in the ballpark of +15-20 %, depending on sector rotation and commodity price movements. For example, some sources list ~17.9 % over that period.
- Volatility has varied; 52-week lows vs highs show substantial swings, particularly influenced by energy/commodity sectors.
Drivers of Returns
- Commodity Prices: Energy, metals & mining are heavy in the index; fluctuations in oil, gold, etc., heavily affect sector performance and thus overall index movements.
- Domestic Economic Policy: Bank of Canada’s interest rate decisions, inflation, trade policies with U.S./global partners.
- Global Factors: USD strength, global demand (especially China), currency fluctuations.
- Sector Rotation: Shifts between financials, energy, tech affect relative performance. Technology and consumer-oriented stocks are gaining importance in recent years.
S&P/TSX 60 vs. Related Indices
Understanding how TSX 60 compares to other benchmarks helps position it in asset allocation and benchmarking.
| Index | Comparison / Differences |
|---|---|
| S&P/TSX Composite Index | The Composite is broader (over 200+ companies), includes mid & smaller caps. TSX 60 is a subset focusing on large-caps, so it’s less volatile and more concentrated. |
| TSX Completion Index | Covers all TSX listings excluding the TSX 60; good for exposure to mid- and small-caps. A combined portfolio of TSX 60 + Completion approximates Composite. |
| Global Indices (e.g. S&P Global 1200, MSCI Canada etc.) | TSX 60 is the Canadian component of some global benchmarks. Its sector profile (especially energy, materials) differs from say U.S./Europe where tech tends to dominate more. Helpful for international comparison. |
How Investors & Traders Use the TSX 60
The TSX 60 has multiple use cases, from passive exposure to active strategies.
Investment Vehicles
- ETFs / Index Funds: Funds tracking the TSX 60 allow exposure without picking individual stocks. Examples include BMO S&P/TSX 60 Index ETF, BetaPro products etc.
- Structured Products: Derivatives, index linked notes, etc., often reference the TSX 60.
Trading / Portfolio Strategies
- Sector rotation: Given the heavy exposure to financials and energy, traders often overweight/underweight those sectors based on macro outlooks (oil, interest rates, regulatory environment).
- Hedging Currency Risk: For foreign investors, currency risk (CAD vs USD or other currencies) is non-trivial. Hedging strategies may use futures or currency forwards.
- Pairs and Relative Value Trades: Comparing TSX 60 performance vs S&P 500 or other indices to exploit divergence.
Risks & Limitations
No index is perfect. The TSX 60 has specific vulnerabilities and constraints to be aware of.
- Concentration Risk: Because large cap firms command large weights (financials, energy), poor performance in those sectors can disproportionately drag the index.
- Commodity Dependence: China demand, oil prices, precious metals – large swings in those markets affect index performance strongly.
- Interest Rate Sensitivity: Financial sector profits, utilities, etc., are sensitive to interest rates, yield curves. Changes in BoC policy or global rates matter.
- Currency Fluctuations: For non-CAD investors, or companies with large US dollar exposure, CAD movements can erode gains.
- Regulatory / Environmental Risks: Especially in energy, mining sectors → carbon regulation, environmental policy, resource nationalism.
Outlook & What to Watch
Here are key trends and data points that are likely to influence the TSX 60 going forward:
- Energy & Commodity Prices
Oil, natural gas, metals will continue to be major drivers. Global supply shocks, geopolitical risk, renewable energy policy will all matter. - Interest Rate Policies
The Bank of Canada’s decisions around rate cuts or tightening, inflation pressures, and global central bank alignment will be critical. - Technology & Innovation
Though historically underweighted vs US indices, growing tech / digital service firms in Canada (Shopify, etc.) could shift the balance. - Global Economic Growth
Especially in China, U.S., EU – export demand, commodity demand will impact. - Environmental, Social, Governance (ESG)
Increasingly, ESG considerations matter for investor flows, regulatory risk, and capital cost. - Currency Trends
CAD strength or weakness vs USD or other major currencies will affect returns for international investors and companies with global operations.
Detailed Performance Metrics (As of Most Recent Data)
| Metric | Value / Range |
|---|---|
| Latest Index Level | ~ 1,740-1,760 CAD (recent values, but subject to intra-day fluctuation) |
| 52-week High / Low | High ~ 1,740+, Low ~ 1,330-1,350 range |
| 1-year Return | Mid-teens percentage gains (≈ +15-20 %) depending on the exact timeframe & sector composition. |
| Volatility (Short-term) | Intra-day & monthly swings tend to be higher during commodity cycles and interest-rate changes. |
How to Access TSX 60 Exposure
- Buy an ETF that tracks TSX 60 (CAD-denominated, possibly USD hedged).
- Use index funds or mutual funds with TSX 60 or large-cap Canadian exposure.
- For leverage or inverse bets: some providers offer leveraged or inverse TSX 60 products. (Note: these are higher risk.)
Frequently Asked Questions (FAQs)
Q1: How often is the index rebalanced?
A: Regular reviews occur (e.g. quarterly) to ensure constituents meet eligibility and sector/weighting balance is maintained. Companies may be added or removed due to market capitalization shifts, mergers, delistings.
Q2: Is the index total-return or price-return?
A: Standard reporting is price return (i.e. excludes dividends), but data is available (via S&P) for total return (includes reinvested dividends).
Q3: Can non-Canadian investors invest directly?
A: Yes, via Canadian ETFs, or via cross-border brokerage that allows buying into Canadian securities. Be mindful of FX risk, tax implications (withholding, treaties).
Q4: How does the TSX 60 compare in risk vs US large-cap gauges (like S&P 500)?
A: While both cover large caps, TSX 60 is more exposed to commodities and energy, so tends to have more volatility during commodity cycles. Also, Canada’s economy is more tied to natural resources and its trading partners.
Q5: Are there sector caps to avoid overconcentration?
A: Yes. The methodology includes limits / checks to avoid dominance by any one company or sector, to maintain index stability. Exact caps are publicly documented in the S&P methodology.
Conclusion
The S&P/TSX 60 is a powerful tool for capturing the performance of Canada’s largest and most influential companies. It offers:
- High exposure to sectors central to the Canadian economy (financials, energy, materials).
- Solid large-cap stability, yet still participation in growth via technology and industrials.
- Comparatively lower volatility vs small/mid-cap segments but higher exposure to commodity and interest‐rate risk.
For investors or traders, leveraging the TSX 60 (or ETFs that track it) makes sense where you believe in Canada’s macro fundamentals, or want diversified exposure to energy & resource cycles, balanced with financial sector strength.
 XAUT-USD
 AMD
AMD JNJ
JNJ MARA
MARA SHOP
SHOP UNH
UNH BULL
BULL EURUSD=X
 CL=F
CL=F