
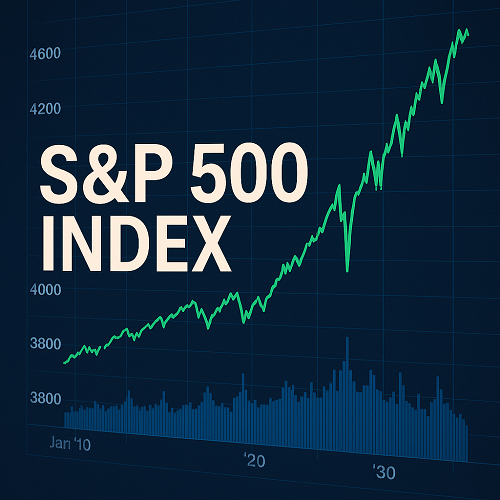
The S&P 500 Index (SP500) is one of the world’s most important financial benchmarks. Investors interested in the s p500 should note that it reflects the performance of 500 leading U.S. companies and represents roughly 80% of total U.S. stock market capitalization. Investors, economists, traders, and institutions worldwide track the S&P 500 because it acts as a real-time barometer of market health, risk appetite, and economic momentum.
This comprehensive guide goes far beyond the basic data provided on FRED’s SP500 page. It delivers the context, explanation, history, analysis, and strategic insights needed to understand the index at a professional level—whether you’re a long-term investor, a forex trader, or someone navigating crypto markets.
What Is the S&P 500?
The S&P 500 is a float-adjusted, market-capitalization-weighted index composed of 500 of the largest and most influential publicly traded companies in the United States. It is maintained by S&P Dow Jones Indices, and its components represent diverse sectors including technology, healthcare, energy, industrials, and consumer goods.
Key Features
- 500 large-cap U.S. stocks
- ≈ 80% of the U.S. equity market
- Float-adjusted weighting (company influence depends on real tradable market cap)
- Quarterly rebalancing
- Price index (no dividends included)
For investors and traders, the S&P 500 is the benchmark for U.S. stock performance and global risk sentiment.
How the S&P 500 SP500 Is Constructed
The index follows strict inclusion criteria:
Inclusion Requirements
- U.S. company
- Market cap meeting a minimum threshold
- Adequate liquidity
- Positive earnings over the most recent quarter and year
- Sector and industry representation considerations
Weighting Method
Unlike equal-weighted or price-weighted indices, the S&P 500 uses:
Float-adjusted market-cap weighting
Meaning only freely tradable shares count when calculating company influence.
This ensures the index reflects actual market value—not insider or restricted shares.
Why this matters:
Large companies like Apple, Microsoft, Amazon, and NVIDIA have outsized impact on day-to-day movements of the index.
Interpreting the FRED SP500 Series
The FRED page provides the daily closing value of the S&P 500 index:
- Price index (excludes dividends)
- Not seasonally adjusted
- Updated daily
- Long historical dataset
Although valuable for historical charting and macroeconomic research, the FRED dataset does not include:
- Total-return data
- Sector breakdowns
- Dividend yield
- Valuation metrics
This article complements those missing areas with the deeper financial perspective traders and investors need.
Historical Performance of the S&P 500
The S&P 500 has delivered exceptional long-term performance, making it the backbone of countless investment portfolios.
Long-Term Return Characteristics
- ~10% average annual nominal return
- ~6–7% average real return after inflation
- One of the highest risk-adjusted returns of any major asset class
Major Historical Phases
The 1982–2000 Bull Market
- Driven by falling interest rates, globalization, and technology adoption
- One of the strongest multi-decade advances in market history
2000–2002 Dot-Com Bust
- Many tech companies collapsed
- The index lost nearly half its value
2007–2009 Global Financial Crisis
- Severe liquidity crisis
- S&P 500 dropped over 50% from peak to trough
2009–2021 Post-GFC Expansion
- Low interest rates, massive tech growth
- S&P 500 returned over 500%
2022–2023 Inflation & Rate Shock
- Rapid monetary tightening
- Short but intense correction
Despite repeated crashes, the S&P 500 has always recovered to new highs—a major reason so many investors commit to long-term index investing.
Why the S&P 500 Rises Over Time
The long-term upward trajectory is driven by several structural forces:
1. Economic Growth
U.S. GDP has expanded dramatically over decades, fueling corporate earnings.
2. Productivity Improvements
Technology, automation, and digitization increase profitability.
3. Inflation
Nominal asset values tend to rise with general price levels.
4. Share Buybacks & Dividends
S&P 500 companies buy back billions in shares annually, boosting earnings per share.
5. Market Leadership Rotation
Innovative sectors (e.g., tech, biotech, communications) replace slower-growing industries.
These combined forces create persistent upward pressure, despite periodic downturns.
Risks & Limitations of the S P500
Even the world’s premier index carries risks.
1. Concentration Risk
A small number of mega-cap tech companies often account for a large percentage of index performance.
2. Valuation Risk
Elevated P/E ratios increase the chance of future lower returns.
3. Economic Cycles
Recessions, policy tightening, or geopolitical shocks cause volatility.
4. Price Index Limitations
Because the FRED SP500 dataset excludes dividends, it understates total returns.
5. Sector Imbalances
Tech frequently dominates, reducing diversification benefits.
Understanding these risks is essential when using the index for investing or trading decisions.
The S&P 500 in a Multi-Asset Context
The index interacts with other markets in important ways.
S&P 500 vs. Dow Jones
- Dow: price-weighted, only 30 companies
- S&P 500: broader, more representative
S&P 500 vs. NASDAQ Composite
- NASDAQ is more tech-heavy
- More volatile, higher growth potential
Correlation With Bonds
- Equities often move inverse to Treasuries (risk-on vs risk-off dynamics)
Correlation With Forex
- S&P 500 strength generally coincides with a weaker USD in risk-on environments
- Conversely, S&P 500 weakness usually strengthens safe-haven currencies (USD, JPY, CHF)
Correlation With Crypto
- During macro stress, crypto tends to correlate with equities
- Strong S&P 500 rallies often support Bitcoin and other risk assets
Outlook for the S&P 500: Short-Term & Long-Term
Short-Term Drivers
- Federal Reserve interest rate policy
- Inflation data
- Earnings season results
- Employment trends
- Corporate guidance in tech and AI sectors
Long-Term Drivers
- Technological innovation (AI, cloud, automation, biotech)
- Demographic trends
- Globalization vs deglobalization
- Fiscal and monetary cycles
Expected Returns
Most large investment banks expect moderate but positive returns over the next decade, somewhat lower than the 2010–2021 era due to valuations and interest rate normalization.
Trading & Investing Strategies Using the S&P 500
This section provides actionable strategies for stock traders, forex traders, and crypto traders.
A. Stock Market Investors
1. Buy-and-Hold with Low-Cost Index Funds
ETFs such as:
- SPY
- IVV
- VOO
offer low-cost exposure with strong long-term performance.
2. Dollar-Cost Averaging
A consistent monthly investment reduces timing risk.
3. Sector Rotation Strategies
Analyze which sectors lead during:
- Early-cycle recoveries
- Mid-cycle expansions
- Late-cycle slowdowns
4. Hedging With Options
- Protective puts
- Covered calls
- Collar strategies
Useful during high volatility or recession-risk periods.
B. Forex Traders
The S P500 is an excellent risk-sentiment indicator:
Risk-On Environment
- Stocks rise
- USD often weakens
- AUD, NZD, GBP strengthen
- Emerging market currencies benefit
Risk-Off Environment
- Stocks fall
- USD, JPY, CHF strengthen
- Commodity currencies weaken
Trade Example:
If S&P 500 breaks below key support during a recession scare, short AUD/USD or long USD/JPY may be high-probability setups.
C. Crypto Traders
Crypto increasingly behaves like a high-beta version of the S&P 500.
Signals to Watch
- Strong S P500 uptrend → bullish for BTC, ETH
- High volatility in stocks → spikes in crypto volatility
- Fed tightening → negative for both equities and crypto
Strategy Note:
Use S&P 500 trend direction to gauge overall risk appetite before making large crypto allocations.
Key Takeaways
- The S P500 is the most important indicator of U.S. stock market performance.
- Its long-term trend is up due to economic growth, innovation, and corporate earnings expansion.
- The FRED SP500 dataset is useful, but incomplete—it excludes dividends and valuation context.
- Traders across stocks, forex, and crypto can use S&P 500 movements to gauge risk sentiment and strengthen strategy.
- While historically strong, the index carries risks: concentration, valuations, and economic cycles.
Final Word
The S P500 remains the cornerstone of global investing. Whether you are building a long-term portfolio, trading currencies, or managing crypto exposure, understanding this index gives you a powerful edge. With the right knowledge, perspective, and strategy, the S&P 500 is not merely a chart—it is a road map to long-term wealth creation and informed trading decisions.
 XAUT-USD
 AMD
AMD JNJ
JNJ MARA
MARA SHOP
SHOP UNH
UNH BULL
BULL EURUSD=X
 CL=F
CL=F