The S&P 500 (ticker: “SPX” in many platforms) is not just a barometer of U.S. equities — it’s widely regarded as the benchmark for large-cap performance, investor sentiment, and economic health. While Yahoo Finance provides a snapshot (price, chart, news) for ^SPX that view lacks deeper context for serious traders, allocators, and analysts. This article fills that gap by giving you a complete, forward-looking resource.
Key reasons SPX is so central:
- It captures roughly 80%+ of U.S. equity market capitalization (by float-adjusted metrics).
- It’s used as the reference benchmark for mutual funds, ETFs, derivatives, and active strategies.
- Its behavior is tightly correlated with macro cycles, monetary policy, and sentiment shifts.
By mastering SPX, you gain insight into both broad market direction and tactical trading opportunities.
What Is the S&P 500 Index?
The S&P 500 (Standard & Poor’s 500) is a market-capitalization-weighted equity index comprising 500 of the largest, most liquid U.S. companies.
- It was launched in its present form in 1957, evolving from earlier versions that tracked fewer stocks.
- It is often considered the premier measure of the performance of U.S. large-cap equity markets.
- Because it’s an index (not a tradeable security), investors use instruments like ETFs, futures, and derivatives for exposure.
Important nuance: The S&P index listed on Yahoo as ^SPX is a price-return index — it does not include dividends. Many fund/index products track a total return version (which reinvests dividends).
Methodology & Construction
To trade or analyze SPX meaningfully, you must understand how it’s built and maintained.
Market-Cap Weighting & Float Adjustment
- Companies in the index are weighted by float-adjusted market capitalization — i.e. only publicly traded shares are counted (excluding restricted shares).
- As a result, large-cap names (Apple, Microsoft, etc.) tend to dominate the index.
- This weighting implicitly assumes size contributes to influence; it emphasizes exposure to “winners” (largest firms).
Selection Criteria & Rebalancing
Inclusion in the S&P 500 is not automatic; it is governed by a committee with rules based on:
- Minimum market capitalization thresholds
- Liquidity (trading volume, turnover)
- Domicile, financial viability, public float
- Sector balance and representation
The index is reviewed and occasionally rebalanced to reflect corporate actions (mergers, delistings, spinoffs).
Divisor & Index Calculation
- The total adjusted market cap of the 500 stocks is divided by a proprietary index divisor to normalize the index value.
- The divisor is periodically adjusted to preserve continuity following corporate actions (stock splits, spin-offs, etc.).
- Because the divisor is not publicly released, you can’t exactly replicate the index yourself from raw market caps — but you can approximate its direction.
Sectors & Key Constituents
Sector Breakdown
The S&P 500 is divided into 11 GICS sectors, such as:
- Information Technology
- Health Care
- Financials
- Communication Services
- Consumer Discretionary
- Industrials
- Materials
- Consumer Staples
- Utilities
- Real Estate
- Energy
Over recent years, Technology and Communication Services have held disproportionate weight due to mega-cap firms in those sectors.
Top 10 Companies by Weight (Recent Snapshot)
While exact weights vary with market moves, top names often include:
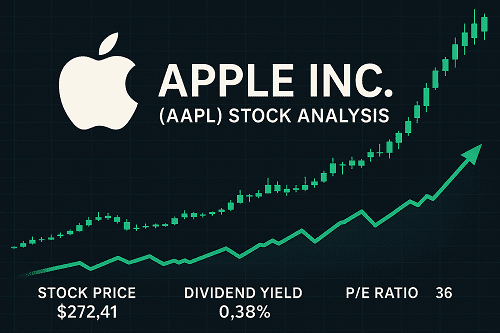
- Apple (AAPL)
- Microsoft (MSFT)
- NVIDIA (NVDA)
- Amazon (AMZN)
- Alphabet (GOOGL / GOOG)
- Meta (META)
- Tesla (TSLA)
- Berkshire Hathaway (BRK.B)
- UnitedHealth Group (UNH)
- JPMorgan Chase (JPM)
These heavyweights can sway the index’s direction significantly. A 1% move in a ~5% weight name yields ~0.05% move in SPX all else equal.
How to Access Exposure to SPX
Because SPX is an index, here are the common ways to gain exposure:
Index Funds & ETFs
- SPDR S&P 500 ETF Trust (SPY) – among the most liquid and tracked ETFs globally.
- Vanguard S&P 500 ETF (VOO), iShares Core S&P 500 ETF (IVV), etc.
- These ETFs aim to replicate the total return of the S&P 500 (dividends included).
Futures, Options & Derivatives
- E-mini S&P 500 futures (ES) and Micro E-mini provide leveraged exposure.
- Options on SPX / SPY enable directional, hedging or income strategies.
- Index CFDs (in certain regions/platforms) allow margin-based trading on SPX.
CFDs, Leveraged Products & Structured Notes
- In international / FX broking platforms, SPX CFDs let traders go long/short with leverage.
- Some structured products / funds provide enhanced returns or buffer features.
Each vehicle carries its trade-offs: costs, tracking error, leverage risk, margin calls, counterparty risk, etc.
Historical Performance & Return Statistics
Long-Term Return Metrics
- Over decades, the S&P 500 has delivered ~7–10% annualized returns (inclusive of dividends).
- Volatility over long horizons tends to smooth out, but the path is highly nonlinear.
Drawdowns & Crashes
- Major drawdowns include the Dot-Com crash (2000–2002), Financial Crisis (2007–2009), COVID-19 crash (2020).
- Some drawdowns exceeded 30–50% from peak to trough.
- Recovery periods vary; e.g., 2007–2009 took multiple years to recoup.
Volatility & Risk Measures
- Standard deviation of annual returns historically ~15–20% (varies widely by epoch).
- Maximum drawdowns (MDD), Sharpe ratios, Sortino ratios are useful metrics for comparing strategies.
- Tail risk is non-negligible — the S&P can gap and move sharply in crisis periods.
Drivers & Catalysts Affecting SPX
Understanding what drives SPX is critical to positioning.
Macroeconomic Variables
- GDP growth: Economic expansion supports earnings growth and equity demand.
- Inflation: High inflation erodes real returns; central banks often respond with rate hikes.
- Interest Rates / Yield Curve: Rising yields tend to pull multiple compression; inverted curves presage recessions.
Corporate Earnings & Profitability
- Ultimately, equity value ties to cash flows and earnings growth.
- Margins, revenue growth, guidance, capital allocation decisions matter.
Monetary Policy, Central Banks & Fed
- The Fed’s rate decisions and forward guidance carry strong influence on risk assets.
- Quantitative easing, tapering, liquidity injections or drain can shift risk appetite.
Global Shocks, Sentiment & Geopolitics
- Crises, wars, supply-chain shocks, regulatory changes, pandemics — all affect risk premium.
- Market sentiment (exuberance or fear) often exaggerates directional moves.
Technical & Quantitative Frameworks
Trend, Momentum & Cycles
- Trend-following models (moving averages, breakout systems) work well in sustained markets.
- Momentum in relative strength (RSI, MACD trends) often helps confirm directional bias.
Mean Reversion vs. Trend-Following
- In choppy markets, mean reversion strategies (bounces off support, oscillators) may outperform.
- Hybrid strategies that adapt regime-switching can mitigate whipsaw.
Quant Models, Factor Exposures & Smart Beta
- Factor models (size, value, momentum, quality) can decompose index behavior.
- Smart-beta / alternative-weighted indices attempt to improve risk-adjusted returns.
Trading Strategies & Tactics
Long-Term Buy-and-Hold
- Suitable for strategic investors focused on asset accumulation.
- Lower turnover, cost-efficient, tax-aware.
Tactical Allocation & Rotation
- Overweight or underweight SPX vs. alternatives (bonds, commodities) based on macro regime.
- Rotate sector or style tilts based on momentum, valuation, sentiment.
Hedging & Risk Management
- Use options (protective puts, collars) to limit downside.
- Use stop-loss levels, trailing stops, volatility-based position sizing.
Leverage, Margin & Futures Approaches
- Futures amplify returns (and losses).
- Careful margin control is essential; avoid over-levering in volatile markets.
Risks, Pitfalls & Limitations
- Concentration risk: heavy dominance by a few mega-cap names.
- Valuation bubbles: index may overshoot fundamentals.
- Interest rate shocks: policy tightening can trigger rapid multiple compression.
- Liquidity & gap risk: sudden gaps at open, news events.
- Tracking error & expenses: ETFs, derivatives aren’t perfectly frictionless.
- Behavioral biases: overconfidence, herding, anchoring.
Outlook & Forecasts for SPX
Base, Bull & Bear Cases
| Scenario | Key Assumptions | SPX Outlook |
|---|---|---|
| Base Case | Moderate GDP growth, inflation cooling, stable Fed rates | Modest to decent annual gains (mid-single digits) |
| Bull Case | Strong tech and earnings surprise, rate cuts, liquidity tailwinds | Return potential of double-digit gains |
| Bear Case | Persistent inflation, policy misstep, recession | Losses in the 10–25% range or worse depending on severity |
Scenario Analysis
- Valuation Case: Suppose forward P/E reverts to 17x with earnings growth of 5% — S&P might return ~5–7%.
- Shock Case: In a recession-driven drawdown, multiple compression could shrink returns dramatically.
- Regularly stress-test scenarios: inflation shock, credit crisis, geopolitical shock.
FAQs (People Also Ask)
Q. Can I invest directly in the S&P 500 index?
A. No — it is an index. You can instead invest via ETFs, mutual funds, futures, or derivatives.
Q. Does the SPX include dividends?
A. The price index version (e.g. ^SPX) does not include dividends. Many replicating funds track a total return version.
Q. How often is the S&P 500 rebalanced?
A. Changes occur continuously when necessary (corporate actions) and officially reviewed quarterly or semi-annually.
Q. Which is better: SPY or VOO?
A. Both track the same index. Differences lie in expense ratios, liquidity, issuer, etc.
Q. How does interest rate rise affect SPX?
A. Rising rates often lead to multiple contraction (valuation falling), especially hurt growth / high-multiple stocks.
Q. What’s the expected return over 10 years?
A. Historically, 7–10% annualized. But future may be lower depending on valuations, interest rates, and growth headwinds.
Conclusion & Key Takeaways
- The S&P 500 (SPX) is the most widely followed gauge of U.S. large-cap equities — but its behavior is shaped by macro, earnings, and sentiment dynamics.
- To trade or invest in SPX effectively, you must understand its methodology, risks, and drivers — not just glance at price charts.
- Your toolbox should include ETFs, options, futures, and hedging techniques — used sensibly with risk controls.
- Forecasting SPX requires scenario analysis more than precise predictions; think in ranges and probabilities.
- Always balance reward and risk, avoid leverage excess, and stay adaptive to regime shifts.


 XAUT-USD
 AMD
AMD MARA
MARA SHOP
SHOP BULL
BULL CL=F
CL=F