
Current Market Snapshot
- The stock is trading in the low-$22 range (~ US$22.42) per latest quote.
- Over the past 50 days, it has ranged roughly US$22.44 → US$26.92.
- On recent trading days the price weakened as peers reported cost inflation concerns.
- Analyst consensus remains a “Moderate Buy,” with average 12-month price target near US$27.80 (implies ~18% upside from current).
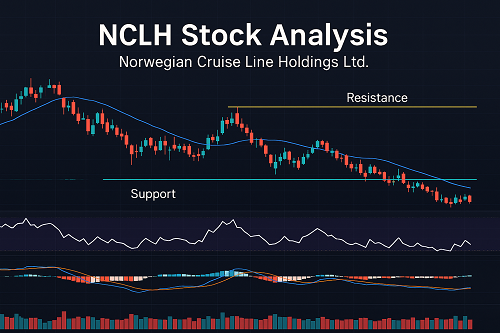
Trading implication: The stock is in a zone where both short-term traders and swing traders might be active: support near US$22–23, resistance in the mid-US$26 region, with potential for 5-10% moves if momentum triggers.
Technical Setup & Momentum Indicators
A. Support & Resistance Levels
- Support zone: ~US$22.00 to US$23.00 — recent 50-day low around U$22.44.
- Resistance zone: US$26.50–27.00 — upper bound of recent range and near average analyst target.
- Intermediate pivot: ~US$24.50 — midrange, may act as short-term intra‐week decision point.
B. Trend & Moving Averages
- The 50-day moving average is roughly ~US$24.50 (per data ~US$24.54).
- Price is currently below that MA — bearish short-term trend signal (for traders needing confirmation).
- The 200-day MA probably lies well above current (~US$30+), so from a longer-term trend view the stock is in a correction/pull-back.
C. Momentum & Volatility Signals
- Recent article notes: “23 moves greater than 5% over the last year” → high volatility, attractive for active trading.
- Options flow: Some of the data (via TipRanks) show elevated call volume in past months for NCLH.
- Volume spikes often accompany booking or cost-related news for the cruise sector → traders should monitor “news + volume” combos.
Key Catalysts & Sentiment Triggers
A. Upcoming Earnings & Industry Cost Pressure
- Peer Royal Caribbean Group (RCL) reported cost pressures (net cruise costs excluding fuel up 4.8% in constant currency) which weighed on the sector and on NCLH.
- NCLH’s own Q3 earnings are scheduled for Nov 4, 2025 (before market open).
- Forecast: EPS ~$1.14, Revenue ~$3.02 billion.
- Traders should treat the earnings date as a potential volatility inflection point. A beat could trigger breakout; a miss could prompt breakdown.
B. Industry Sentiment & Valuation
- NCLH is trading with a forward P/E of ~10.4x, below industry average ~19.2x — suggesting it is relatively cheap vs peers.
- Analyst upgrades and raised targets (e.g., Truist boosting to ~$31) lend positive sentiment.
- However, cost inflation (fuel, staffing), emerging travel headwinds, and macro uncertainty are recurring risk themes.
C. Technical/Trading Specifics
- Because of heightened volatility and defined trading ranges, traders can consider range-play setups:
- Long near support (~US$22.00) with stop below support.
- Short or wait for rejection near resistance (~US$26.50-27.00).
- Watch for volume confirmation: e.g., breakout above US$26.50 with heavy volume could trigger momentum trade.
- Also, options activity may provide leading signals: elevated call volume may precede bullish moves; elevated put volume may caution.
Trade Scenarios & Risk/Reward Profiles
Scenario A – Bullish Breakout
- Trigger: Strong earnings beat + optimistic guidance on Nov 4.
- Entry: Wait for decisive break above US$26.50 on volume > average.
- Target: US$30–31 region (aligns with higher analyst targets).
- Stop-loss: Below breakout level ~US$25.50 (or lower if more conservative).
- Risk: Failure to beat or weak guidance → reversal back to US$22.00 support or lower.
Scenario B – Range Continuation / Pullback
- Trigger: Mixed earnings/outlook or cost concerns persist → Price stays below resistance.
- Entry: Short near US$26.00-26.50 with stop above US$27.50. Target support ~US$22.50-22.00.
- Alternatively: Long near support ~US$22.00 with tight stop below ~US$21.50, target ~US$24.50-25.00.
- Risk: False breakdown or reversal boom spikes price, crushing the short; or long gets invalidated by break below support.
Scenario C – Volatility Event Trade
- Trigger: Strong sector news (travel demand shock, geopolitical disruption, fuel cost surge) or option flow breakout.
- Approach: Straddle strategy (in options) or limited‐risk directional trade with smaller size.
- Timeframe: Intraday to 1–2-week horizon.
- Risk: Whipsaw action, fast moves out of expected range.
Watch-List: Key Levels & Indicators to Monitor
| Metric | Level / Signal |
|---|---|
| Support | ~US$22.00 – US$23.00 |
| Resistance | ~US$26.50 – US$27.00 |
| 50-day MA | ~US$24.50 |
| Volume surge threshold | Daily volume > ~14-15 million (avg ~12.7m) |
| Options flow alert | Elevated call or put activity near key levels |
| Earnings date trigger | Nov 4, 2025 (pre-market) |
| Sector cost/booking news | Monitor for cost inflation (fuel, staffing) and booking momentum |
Risk Considerations & Trader Cautions
- High leverage of underlying business: Cruise operators highly sensitive to macro/travel shocks (pandemics, geopolitical, fuel).
- Cost inflation risk: As seen with peers, rising costs may squeeze margins.
- Liquidity/volume risk: In volatile stocks, stops may get triggered then rebound (‘stop-hunt’).
- Earnings slippage: Even in a strong demand environment, if guidance misses or costs blow out, price can swiftly reverse.
- Sector correlation: NCLH often moves with travel/leisure sector sentiment broadly; external shocks may override company-specific strategy.
Summary & Trade-Ready Outlook
- NCLH presents an interesting active-trader opportunity given its clearly defined support/resistance, upcoming catalyst (earnings), and relative valuation discount vs peers.
- From a short-term trading lens:
- Long bias: only after confirmation (breakout above resistance or bounce from strong support + volume).
- Short/range bias: if the price fails to breakout and remains under resistance, with cost and macro headwinds remaining.
- Risk/Reward: The risk from support to resistance (~US$22 → US$27) offers roughly 5-25% potential depending on set-up, which is attractive for active trading.
- Key date: Nov 4 earnings event could be a turning point — be ready ahead of time (position size, stop placement) rather than reacting after the fact.
- Execution discipline: Given volatility, use stop-loss orders, limit sizes relative to portfolio, and monitor intraday volume and options signals.

 XAUT-USD
 AMD
AMD JNJ
JNJ MARA
MARA SHOP
SHOP UNH
UNH BULL
BULL EURUSD=X
 CL=F
CL=F