
PayPal Holdings Inc. (NASDAQ: PYPL) continues to draw attention from active traders seeking mid-term volatility, solid liquidity, and clear technical structures.
Despite years of underperformance since its 2021 highs near $310, PayPal has found a technical and fundamental base in 2024–2025 — creating fresh opportunities for swing traders positioned for a rebound toward fair-value levels.
PayPal operates as one of the world’s largest digital payment networks, connecting over 430 million active accounts globally. Its product ecosystem spans Venmo, Braintree, Xoom, and now PayPal USD (PYUSD) — a regulated stablecoin backed by U.S. dollar deposits and short-term treasuries.
Fundamental Overview: Leaner, Profitable, and Crypto-Enabled
Revenue and Margin Trends
- FY 2024 revenue: ≈ $29 billion, up 7 % YoY
- Operating margin: ≈ 18 % (post-cost discipline under CEO Alex Chriss)
- EPS growth: Mid-single-digit YoY improvement
- Free cash flow: ≈ $5 billion +, highlighting ample liquidity for buybacks
PayPal’s financial discipline since late 2023 has turned sentiment from bearish to cautiously optimistic. Cost-cutting, workforce reductions, and product simplification have restored investor confidence.
Crypto & Fintech Positioning
PayPal’s PYUSD stablecoin marks a strategic move to bridge fiat and crypto commerce, placing it ahead of legacy fintech peers like Block (SQ) and Stripe in terms of stablecoin settlement readiness.
Buybacks and Valuation
- Active $5 billion share repurchase program through 2025
- P/E ratio ≈ 16 × 2025 EPS — below both fintech peers and S&P 500 average
Valuation edge + improving margins = a solid swing-trade foundation, especially on pullbacks near support zones.
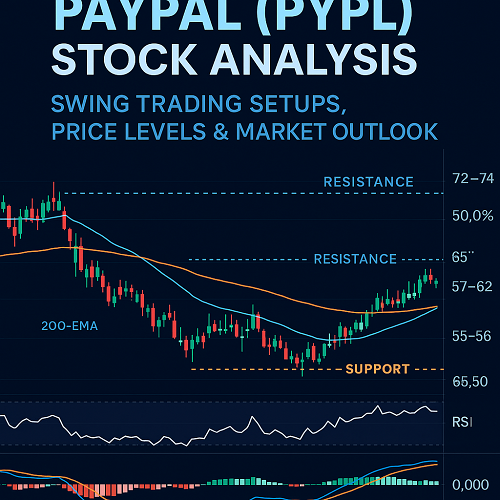
Technical Analysis: Key Levels and Momentum Setup (as of Q4 2025)
Current Price Zone: $57 – $62 range
52-Week Range: $50 – $76
Volume Profile: Strong accumulation in the $55–$60 zone
Trend Structure
- 200-day EMA: ≈ $63.40 → acting as long-term resistance
- 50-day EMA: ≈ $59.10 → recently flattened after prior downtrend
- Price action: Higher lows since June 2025 → early bullish reversal pattern
A breakout above $64 on strong volume could confirm trend reversal, with an intermediate target near $72–$74 (Fibonacci 0.5 retracement from 2022 highs).
Momentum Indicators
| Indicator | Current Reading | Interpretation |
|---|---|---|
| RSI (14) | 54 | Neutral → bullish on strength above 60 |
| MACD | Slightly above signal | Early buy signal confirmation |
| ADX | 22 | Weak trend strength — watch for > 25 for momentum confirmation |
Traders should watch for a bullish EMA crossover (50 EMA > 200 EMA) as a major swing confirmation signal, expected by late Q4 2025 if current momentum persists.
Support & Resistance Levels
| Zone | Type | Importance |
|---|---|---|
| $55 – $56 | Major support | Prior accumulation zone, strong buyer defense |
| $59 – $60 | Short-term support | 20-day EMA alignment |
| $64 – $65 | Resistance 1 | 50 % Fibonacci retracement, prior swing high |
| $72 – $74 | Resistance 2 (Target) | Major breakout target for swing traders |
Fibonacci & Channel Setup
Drawing Fibonacci from the 2022 peak ($310) to 2024 bottom ($50):
- 38.2 % retracement: $88 → mid-term target if momentum holds
- 23.6 % retracement: $72 → primary swing target 2025–H1 2026
Swing trade idea: Buy near $58–$60 support → take profits around $72 → stop below $54 (support break).
That’s a risk/reward ≈ 1 : 3 setup — ideal for position traders over 4–8 weeks.
Catalysts for 2025–2026
a) Earnings Momentum
- Consistent YoY EPS growth > 5 %.
- Expected Q4 2025 guidance raise due to cost efficiency and Venmo monetization.
b) Crypto Adoption
- Expansion of PYUSD beyond U.S. to EU markets by late 2025.
- Merchant integration via PayPal Checkout API and Braintree partners.
c) Strategic Partnerships
- Strengthened alliances with Apple Pay, Visa Direct, and Shopify.
- Collaboration with blockchain infrastructure providers to enable instant settlement.
d) Investor Sentiment
- Institutional accumulation rising (Q3–Q4 2025 13F filings show +6 % institutional ownership).
- Options volume tilting bullish with increased open interest on $70–$75 calls.
Competitor Comparison: PayPal vs Block (SQ) vs Stripe
| Metric (2025 E) | PayPal (PYPL) | Block (SQ) | Stripe (Private) |
|---|---|---|---|
| Market Cap | ≈ $68 B | ≈ $45 B | ≈ $70 B (Private est.) |
| Revenue Growth | 7 % | 10 % (BTC volatility driven) | ≈ 15 % |
| Operating Margin | 18 % | 10 % | 14 % |
| Crypto Exposure | Stablecoin & wallet | Bitcoin trading | Limited for now |
| Valuation (P/E) | 16 × | 35 × | ≈ 25 × (Proxy) |
Conclusion: PayPal offers the best risk-adjusted swing potential given lower valuation and clearer technical base.
Swing Trading Strategy Blueprint
Trade Setup #1 – Support Rebound
- Entry: $58–$60 zone (retest support)
- Stop: $54 (breakdown invalidates)
- Target: $72 (first resistance)
- R/R Ratio: ≈ 1 : 3
Trade Setup #2 – Breakout Continuation
- Entry: Above $65 (close confirmation)
- Stop: $60 (below EMA support)
- Target: $74 – $78 extension
- Momentum Condition: MACD > signal + RSI > 60
Trade Setup #3 – Post-Earnings Momentum
- Entry: Post-earnings gap fill near 50 EMA support.
- Exit: Into Fibonacci targets ($72 – $88).
- Time Horizon: 2–6 weeks.
Risks and Drawdowns
- Consumer spending slowdown → payment volume impact.
- Regulatory risk in crypto stablecoin frameworks.
- Fintech competition (Apple Pay Later, Google Wallet 2.0).
- Bearish sentiment if tech sector rotates to value stocks.
Risk management note: Limit position size to 2–3 % of portfolio per trade given volatility and macro uncertainty.
Outlook for 2026 and Beyond
With earnings stability, PYUSD expansion, and technical momentum improving, PayPal could reclaim the $80 – $90 zone by late 2026 under moderate market conditions.
Continued execution on AI-driven fraud protection and merchant analytics may further boost valuation multiples.
Bullish Scenario (2026): Break above $90 → targets $105–$115.
Bearish Scenario: Break below $50 → retest multi-year lows around $42.
Base Case: $72–$88 range mid-2026.
SEO-Optimized Takeaways for Swing Traders
- PayPal stock analysis 2025: Valuation undervalued vs peers with emerging crypto tailwind.
- PYPL forecast 2025–2026: Targets $72–$88 with EMA reversal confirmation.
- Swing trading PayPal stock: Ideal entries $58–$60; watch breakouts above $65.
- Technical setup: RSI neutral → bullish; MACD positive; EMA flattening.
- Investment thesis: Fundamental turnaround + technical reversal = medium-term alpha potential.
Conclusion: PYPL as a Swing Trade in a Recovery Cycle
PayPal’s story is one of reset and revival.
After three years of decline, the stock has entered a phase of technical stabilization supported by real cash flow and disciplined management.
For swing traders, PYPL offers clear structures, measurable risk, and credible catalysts — rare attributes in a volatile fintech landscape.
Bottom Line: Buy near support, sell into strength, and ride the mid-term trend toward $72–$88 as PayPal redefines digital payments for the crypto-integrated era.

 XAUT-USD
 AMD
AMD JNJ
JNJ MARA
MARA SHOP
SHOP UNH
UNH BULL
BULL EURUSD=X
 CL=F
CL=F