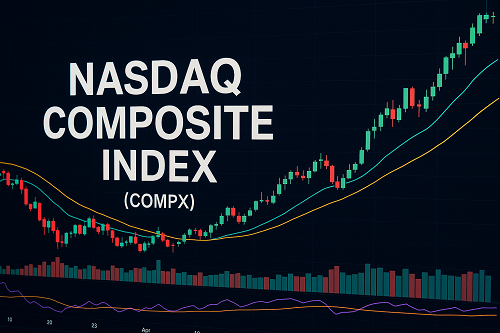
The Nasdaq Composite Index (ticker COMPX, also referenced as ^IXIC) is one of the most widely-followed equity market benchmarks in the United States. It tracks virtually all common stocks listed on the Nasdaq Stock Market, giving a broad-based snapshot of the tech-heavy growth side of the U.S. stock market.
For traders in equities, forex and crypto markets, the Nasdaq Composite serves as a barometer of risk appetite and technology-sector momentum. In this article we’ll explore how it’s constructed, how to interpret its moves, how it compares to other indexes, and how you might integrate it into a trading or investment strategy.
What Is the Nasdaq Composite?
Definition
- The Nasdaq Composite is a market-capitalization-weighted index composed of all the domestic and international common stocks listed solely on the Nasdaq Stock Market (subject to eligibility criteria).
- Because of its broad inclusion, it covers thousands of stocks (over ~3,000 companies, depending on classification) across many sectors—with a significant weighting toward technology.
- It is one of the “big three” U.S. stock indices, alongside the S&P 500 and the Dow Jones Industrial Average — although its behavior tends to be more volatile thanks to its growth/tech bias.
Composition & Eligibility
- To qualify for inclusion, a security must be listed exclusively on the Nasdaq exchange (unless dual-listed prior to 2004 and continuously maintained).
- Eligible securities include common stocks, American Depositary Receipts (ADRs), Real Estate Investment Trusts (REITs), shares of beneficial interest (SBIs), limited partnerships, tracking stocks. Excluded are closed-end funds, convertible bonds, preferred stocks, rights, warrants and other derivatives.
- Because the index is market-cap weighted, the largest companies carry disproportionate influence over its movements — the top handful of stocks can account for a large portion of its performance.
Methodology & Calculation
- The index level is calculated by summing the market capitalizations of all eligible companies, adjusting by an index divisor to arrive at the published figure.
- It is not price-weighted (unlike the Dow). Larger companies (by cap) exert more leverage than smaller ones.
Why It Matters: Key Use-Cases for Traders & Investors
Market Sentiment Gauge
Because the Nasdaq Composite has a heavy weighting toward growth and tech stocks, its movement often reflects investor risk appetite and sentiment toward innovation, high growth, and speculative assets. When the Composite advances strongly, it signals enthusiasm for the growth trade; when it falters, caution may be setting in.
Sector Exposure
While broad, the index’s tilt toward technology (software, semiconductors, internet/consumer tech, biotech) makes it a more dynamic benchmark than the more diversified S&P 500. For that reason, many traders monitor it for signals of emerging strength or weakness in tech.
Cross-Market Implications: Forex & Crypto
- In forex, a rising Nasdaq Composite may correlate with stronger risk-on behaviour: investors shifting into equities and away from safe-haven currencies (e.g., USD, JPY). Conversely, a drop may hint at risk-off sentiment.
- In crypto, given that many crypto traders treat major tech equity moves as cues for risk assets broadly, large moves in the Composite may influence crypto market sentiment (though correlation is not direct or guaranteed).
- For stocks, many index funds and ETFs track the Nasdaq Composite (or subsets thereof), so its performance can affect flows into these products and hence underlying market dynamics.
Historical Milestones & Performance
Key Historic Moments
- The index was launched in 1971 with a base value of 100.
- It surged dramatically during the dot-com bubble (1995-2000), then collapsed during the subsequent bear market.
- More recently, it breached 10,000 in mid-2020 and 20,000 in December 2024 — underscoring the strength of the tech sector and growth stocks.
Recent Performance Snapshot
- According to a recent fact sheet, the Composite tracks over ~2,500 to ~3,500 stocks, with tech often constituting ~60% of the weighting.
- Because of its composition, it tends to exhibit higher volatility than broader indices (such as the S&P 500).
- For example, recent data show a 30-day volatility around 19.7 % and 250-day volatility around 26.5 % for the index.
Comparative Benchmarking
- Compared to the Dow (30 large-cap industrials) and the S&P 500 (500 large-cap stocks diversified across sectors), the Nasdaq Composite offers a purer lens into the growth-tech ecosystem.
- That means while it may outperform in strong growth environments, it may also suffer more in downturns.
How to Interpret the Nasdaq Composite’s Moves
Up-Moves: What They Suggest
- Strong upward momentum in the Composite often signals that major tech companies are performing well, earnings are strong, and risk appetite is high.
- For traders, such a trend may encourage long positions in growth stocks, tech sector ETFs, or correlated risk assets.
- A breakout above historical resistance (e.g., previously breached levels like 20,000) can trigger momentum-driven flows.
Down-Moves: What They Warn
- A sharp decline may indicate investor rotation out of growth, concerns about valuations, rising interest rates, or macro headwinds.
- Because of its concentration, the Composite can be sensitive to problems at a few large-cap tech stocks (which carry outsize weight).
- In the forex arena, such weakness may precede strength in defensive currencies or safe-havens.
Traders’ Technical & Sentiment Considerations
- Monitor support/resistance levels, trendlines, and moving averages on the Composite chart to gauge macro tech-market sentiment.
- Pay attention to market-cap weighted composition: if one or more of the largest stocks are under strain, the index may be dragged downward even if smaller stocks hold up.
- Use the Composite as a confirmation tool: e.g., if you’re trading a tech stock or correlated asset, check whether the broader tech market (via the Composite) is aligned.
- Consider macro factors: interest-rate changes, inflation data, regulatory headlines (especially tech regulation) can impact tech growth stocks and thus the Composite.
Investing & Trading the Index
Direct vs Indirect Exposure
- You cannot trade the Composite directly (unless via derivatives or index futures/options), but you can gain exposure via ETFs or mutual funds that track the Composite or closely correlated indices.
- Be aware many funds track the narrower Nasdaq‑100 (the top 100 largest non-financial companies listed on Nasdaq) rather than the full Composite. That means exposure may differ.
Strategy Integration
- Long-term investor: Using the Composite as a benchmark for “growth/tech market health”. If the Composite is trending upwards steadily, it may support a growth-tilted portfolio.
- Short-term trader: Use sudden dips or breakouts in the Composite as signals—especially if your trades are in tech stocks, ETFs or risk assets (crypto, forex risk-on).
- Hedging & diversification: Because the Composite is tech-heavy, if you hold diversified assets and feel tech may under-perform, consider hedges or allocations away from tech.
Limitations & Risks
- Because of its tech bias and heavy weighting of large-cap growth stocks, the Composite may not reflect the broader U.S. economy as well as more diversified indices.
- It can be more volatile and subject to swings when market sentiment or interest-rate expectations change.
- Index funds tracking the Composite may carry sector concentration risk (especially if technology becomes overvalued).
Nasdaq Composite vs Other Major Indices
| Index | Composition & Focus | Primary Use Case |
|---|---|---|
| Nasdaq Composite | ~3,000+ stocks listed on Nasdaq, heavy tech/growth tilt. | Tech-growth exposure, market sentiment in innovation sectors. |
| S&P 500 | 500 large-cap U.S. stocks across sectors. | Broad U.S. large-cap market benchmark. |
| Dow Jones Industrial Average | 30 large-cap industrials, price-weighted. | Blue-chip industrial/legacy companies. |
Because of these differences, the Nasdaq Composite often leads or lags others depending on whether growth/tech is in favour. For instance, during a tech rally the Composite might outperform; during rotation into value or cyclicals it may underperform.
Implications for Forex & Crypto Traders
Forex
- A sustained rise in the Composite may signal global risk-on appetite, supporting higher-yielding currencies (e.g., AUD, NZD) and weaker safe-haven currencies (e.g., USD, JPY).
- Conversely, a sharp drop or correction in the Composite may precede a flight to quality and strength in safe-haven FX pairs (USD/JPY, USD/CHF) or higher demand for USD.
Crypto
- While crypto markets are not strictly correlated to the Nasdaq Composite, many risk-asset flows move in tandem. A tech-stock surge may buoy crypto sentiment; a tech-stock crash may raise risk-aversion and weigh on crypto.
- Traders should monitor the Composite around macro events (Fed decisions, inflation releases) as part of a broader risk-asset view.
What to Watch Right Now: Key Themes & Catalysts
- Earnings from mega-cap tech companies (often large weightings in the Composite) — strong earnings can drive the index higher; misses can hit it disproportionately.
- Interest-rate outlook — rising rates often hurt growth/tech stocks (which dominate the Composite); rate cuts or dovish tone can boost it.
- Inflation data, macro sentiment — strong inflation may dampen growth stocks; weakness may boost risk assets.
- Tech regulation & geopolitical risks — given the tech tilt, regulatory or geopolitical shocks can affect the Composite more than more diversified indexes.
- Rotation into/out of growth — be alert when money flows shift between value/cyclicals and growth/tech; the Composite can signal such rotation.
Practical Checklist for Using the Nasdaq Composite in Your Strategy
- Chart the Composite regularly: track trendlines, supports/resistances (e.g., recent milestone above 20,000) to gauge market state.
- Compare with your traded asset: if you trade a tech stock, ETF, or risk-asset, check whether the Composite is aligned (confirming) or diverging (warning).
- Monitor heavy-weight names: knowing the largest components (e.g., Apple, Microsoft, Amazon, Nvidia, etc) helps interpret where the index risk lies.
- Combine with macro signals: look at Fed commentary, inflation, earnings releases — because they strongly influence growth/tech and thus the Composite.
- Use for hedging or diversification: if you hold assets exposed to growth/tech, a weak Composite may be a signal to hedge. Conversely, a strong Composite may reinforce long positions.
- Don’t treat it as the whole market: remember the Composite is tech-heavy — if you need broad market exposure, you may need to watch the S&P 500 or other indices alongside it.
Summary & Key Takeaways
- The Nasdaq Composite Index (COMPX) is a broad, market-cap weighted index covering all common stocks listed on the Nasdaq exchange.
- It is heavily influenced by technology and growth-oriented companies, making it a key sentiment barometer for growth/risk assets.
- For traders in stocks, forex, or crypto, the Composite offers a powerful gauge of market mood: strength suggests risk-on, weakness suggests risk-off.
- While offering strong insight, it has limitations: its tech/large-cap skew means it may not reflect the wider economy or broader market segments.
- Integrate it into your strategy by monitoring its trend, comparing your assets against its direction, and using it in conjunction with macro and technical signals.


 XAUT-USD
 AMD
AMD MARA
MARA SHOP
SHOP BULL
BULL CL=F
CL=F