
The Nasdaq Composite Index (commonly known by its ticker ^IXIC or .IXIC) is one of the world’s most-followed equity indices, encapsulating the performance of thousands of technology, biotech, and growth-oriented stocks listed on the Nasdaq Stock Market. For traders, analysts, and investors around the world, the Nasdaq Composite serves as a pulse-check on the direction of innovation-driven markets.
In this comprehensive guide, you will find:
- A deep dive into the structure, history, and weighting methodology of the Nasdaq Composite
- Recent performance trends, key milestones, and market drivers
- Fundamental and technical analysis to help you interpret index behavior
- Practical trading strategies tailored to Nasdaq-based approaches (for stocks, futures, ETFs)
- A look ahead: risks, opportunities, and evolving market structure
By the end, you’ll be equipped not just to reference the index but to actively use it in your trading, portfolio management, and market commentary.
What Is the Nasdaq Composite Index?
Definition & Coverage
- The Nasdaq Composite is a broad-based index that tracks the performance of more than 3,000 stocks listed on the Nasdaq exchange.
- Because Nasdaq lists many companies in technology, biotech, internet services, and growth sectors, the index often behaves differently (more volatile, more upside on tech rallies) compared to broader indices like the S&P 500 or Dow Jones.
Index Methodology & Weighting
- It is a market-capitalization–weighted index: larger companies (by market cap) carry more influence over index moves.
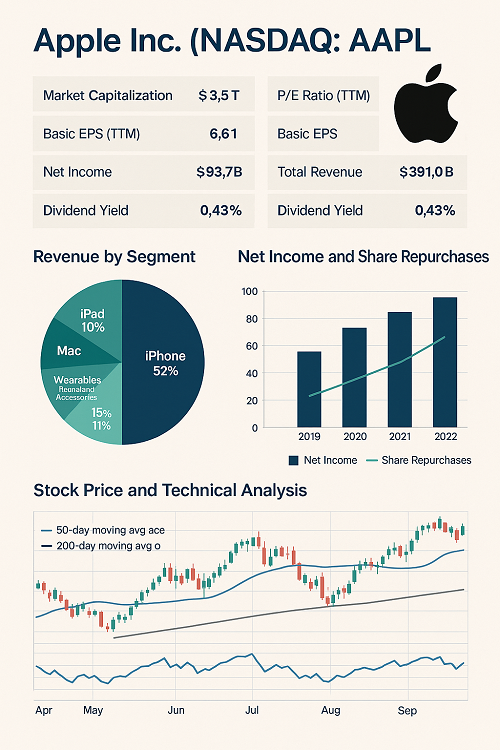
- There is no sector capping; thus, “mega-cap tech” names can sometimes dominate performance (for example, Apple, Microsoft, Nvidia, Amazon).
- Because many smaller and newer firms are included, the index captures not only blue chips but also high-risk, high-reward, early-stage names.
Importance & Role in Markets
- The Nasdaq Composite often acts as a leading indicator of momentum in growth/innovation sectors.
- Many ETFs and derivatives (e.g. Nasdaq futures, options) are tied to its movement, making it central to market structure and hedging.
- It’s commonly referenced by financial media and analysts as shorthand for the “tech market’s health.”
Historical Performance & Milestones
Long-Term Growth
Over decades, the Nasdaq has produced tremendous long-term returns, albeit with volatility:
| Period | Approx Return |
|---|---|
| 10-year (2015–2025) | Often +200%+ (varies with cycle) |
| 20-year | Many-fold gains from technology innovation |
| Since inception (1971) | From ~100 to multi-thousands |
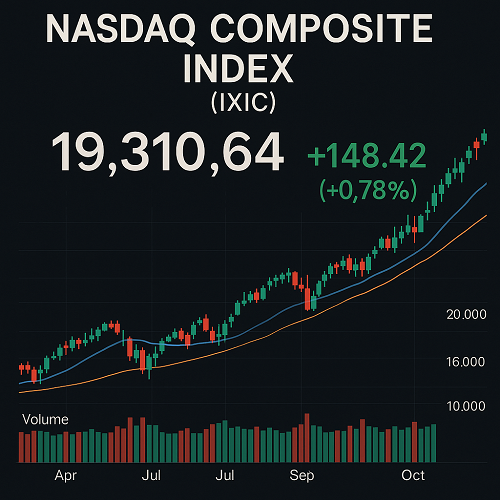
- For example, from 2014 to 2024, the index moved from ~4,176 to ~19,310, an aggregate annualized growth well over 20% in many years.
- The Nasdaq routinely hits historic closing milestones such as 10,000, 20,000, etc. (Its all-time closing high as of October 2025 is ~22,844.05)
Volatility & Bear Markets
- The dot-com bust (2000–2002) and the 2008 financial crisis showed how heavily leveraged or speculative technology exposure can collapse rapidly.
- In bear phases, the Nasdaq falls harder and recovers more dramatically than broader indices, due to concentration in volatile sectors.
Recent Trends & Key Drivers
- In late 2024, the Nasdaq Composite broke through 20,000 for the first time, propelled by surging gains in mega-cap tech stocks and optimism about AI developments.
- As of early October 2025, it has continued pressing toward new highs (closing benchmark ~22,844).
- Key drivers: AI adoption, semiconductor cycles, cloud & SaaS expansion, rate expectations, and macro liquidity.
Fundamental & Technical Analysis
Fundamental Drivers
Technology & Innovation Cycle
Because many of the index’s constituents are in cutting-edge fields (AI, semiconductors, genomics), sector-specific booms (or busts) reverberate strongly through the index.
Interest Rates & Monetary Policy
Growth stocks are more sensitive to discount rates. Low interest rates and accommodative central banks tend to favor extended valuations; rising rates or hawkish monetary policy can trigger sharp reversals.
Earnings Growth & Profit Margins
Margins in tech, software, and biotech are often volatile. As revenue growth slows, margins can compress quickly; conversely, scale and operating leverage can magnify upward swings.
Market Sentiment & Flows
Large inflows into tech ETFs, momentum investing, and passive vehicles can disproportionately boost the Nasdaq during bull runs. On the downside, outflows can accelerate declines.
Technical Indicators & Patterns
Because the Nasdaq is highly traded and often momentum-driven, technicals carry significant weight. Some key indicators to monitor:
- Moving Averages
The 50-day and 200-day simple moving averages (SMAs) often act as support/resistance. When the index trades above its 200-day SMA, it signals broad structural strength (and vice versa). - Relative Strength Index (RSI) / Momentum Oscillators
Overbought (>70) or oversold (<30) readings can hint at pullbacks or reversals, especially when divergence forms. - Trendlines & Channels
Drawing upward or downward diagonal channels helps identify breakouts or breakdowns. - Volume & On-Balance Volume (OBV)
Volume confirmation is crucial for validating moves; shrinking volume during advances may warn of exhaustion. - Volatility Bands (Bollinger, Keltner, ATR)
Expanding bands suggest trending conditions; contracting bands often precede breakouts. - Market Breadth & Advance-Decline Lines
Particularly important in a concentrated index; if only a few stocks lead while many lag, the rally may be brittle.
Example: Current Technical Context
As of latest data, the Nasdaq Composite sits above both its 50-day and 200-day SMA. The RSI (14-day) hovers in a “healthy but not extreme” zone (~63–65), and the index shows moderate volatility.
This suggests that structurally, the trend remains bullish—but vigilance is warranted for sector rotation, liquidity shifts, or correlation breaks.
Trading Strategies Centered on the Nasdaq
You can use the Nasdaq Composite (and its derivatives) in multiple ways. Below are tailored strategies depending on your risk profile, horizon, and instrument availability.
Index Futures & Options
- E-mini Nasdaq (NQ) Futures: Highly liquid, tight spreads, 24-hour trading in many sessions.
- Nasdaq Options / Futures Spreads: Use verticals, iron condors, calendars to express directional or volatility views.
- Overnight / Gap Trading: Because the Nasdaq futures trade outside U.S. hours, gaps at open are common—great for tactical plays.
ETFs Tracking Nasdaq or Tech
- QQQ (Invesco QQQ Trust) is one of the most popular ETFs tracking the Nasdaq-100, which is a subset of the composite focusing on big-cap tech.
- TQQQ / SQQQ for leveraged exposure (3× long or short), with high risk/high reward.
- Multi-sector tech/growth ETFs also provide exposure with some diversification (e.g. XLK, VGT).
Sector & Stock Strategies
- Relative Strength Rotation: Shift capital toward Nasdaq sectors or stocks that are outperforming within the index.
- Pairs Trades: Long high-momentum Nasdaq stocks & short weaker ones (or hedge via Nasdaq futures).
- Index Overlay: Use a small weight in Nasdaq derivatives as a hedging or alpha-enhancing overlay on a broader equity portfolio.
Risk Management & Position Sizing
- Because Nasdaq is volatile, size positions conservatively (e.g. 1–3% max risk per trade).
- Use stop-loss or trailing stops referenced to ATR or volatility bands.
- Diversify across strategies/timeframes rather than all-in on one directional view.
Sample Strategy: Trend Confirmation Breakouts
- Wait for a breakout above a long-term resistance (e.g. above 22,800).
- Confirm with volume expansion and momentum (RSI rising)
- Enter on retest of breakout zone
- Place stop below the breakout retest low
- Set target at previous projected zones or multiples of risk (e.g. 2×, 3×)
- Trail or scale out as index proceeds
Risks, Challenges & Key Considerations
Extreme Valuation Exposure
Many Nasdaq constituents trade at high valuation multiples (PEG, P/E, forward earnings). A shift in expectations can cause sharp downside.
Sector Concentration & Correlation
A handful of mega-cap tech stocks often dominate index performance. If those underperform, the broader index may suffer even if many smaller names are doing well.
Macro Shocks & Policy Shifts
Fed surprises, geopolitical shocks, inflation surprise, regulatory crackdowns (especially in tech) can rapidly reverse trends.
Liquidity & Volatility Spikes
In stressed markets, liquidity can dry up; bid-ask spreads widen. Volatility feedback loops can drag even quality names.
Derivative & Leveraged Risks
ETFs like TQQQ and futures magnify both gains and losses. Over-leverage can lead to margin calls or forced liquidation in volatile moves.
Frequently Asked Questions (FAQ)
Q1. Is .IXIC the same as the Nasdaq Composite?
Yes — .IXIC is the ticker used by some platforms (e.g. CNBC) for the Nasdaq Composite. It is equivalent to ^IXIC on Yahoo Finance.
Q2. Why does the Nasdaq often lead tech-driven rallies?
Because many high-growth, high-beta, innovation-based firms list on Nasdaq. When investors favor growth, the Nasdaq tends to benefit disproportionately.
Q3. Should I trade Nasdaq futures or ETFs?
It depends on your capital, time horizon, and risk tolerance. Futures provide direct exposure and lower cost (no management fees), but require more margin discipline. ETFs are simpler and better for smaller retail investors.
Q4. How often should I review index technicals or rebalance?
Weekly to monthly is reasonable. But in volatile periods, daily monitoring of momentum and breadth is prudent.
Q5. Can I hedge with Nasdaq derivatives?
Yes — you can partially hedge equity portfolios using Nasdaq futures/options, particularly when your positioning is heavily tilted toward growth sectors.
Outlook & What to Watch
Key Catalysts to Monitor
- Earnings surprises from top Nasdaq constituents (Apple, Nvidia, Microsoft, Amazon)
- Semiconductor cycles and chip demand
- AI innovation & adoption trends
- Monetary policy shifts, Fed decisions, yield curve movements
- Global macro risks: trade tensions, regulation, supply-chain disruptions
- Rotation into value / cyclicals — if capital flows exit growth, Nasdaq could suffer
Possible Scenarios
| Scenario | Likely Impacts on Nasdaq | Strategy Response |
|---|---|---|
| Bull continuation (tech leadership holds) | Further new highs, momentum-driven breakouts | Ride trend, use momentum strategies |
| Rotation / Pullback | Tech underperformance, broader indices rise | Shift to relative strength plays, hedge Nasdaq exposure |
| Policy shock or rate hike | Sharp drawdowns in growth stocks | Defensive hedges, reduce leverage, shift allocation |
| Sector shakeout (e.g. regulation) | Certain names punished, index volatility | Use options as protection, shift to resilient names |
SEO & Keyword Strategy Notes (for your site)
To maximize chances of outranking a quote-only page like CNBC’s .IXIC, consider:
- Keyword targeting: “Nasdaq Composite Index”, “IXIC quote”, “how to trade Nasdaq Composite”, “Nasdaq Composite live”, “Nasdaq Composite strategy”
- Long-tail audience terms: “Nasdaq Composite vs S&P 500”, “Nasdaq Composite forecast 2025”, “Nasdaq Composite trading strategies”
- Semantic relevance: include related terms like “tech stocks index”, “growth stocks index”, “Nasdaq futures”, “QQQ ETF”, “market breadth”, etc.
- Rich internal linking: link to pages on futures, ETFs, macro commentary
- Structured data & table of contents: improve crawlability and user experience
- Frequent updates: since index data evolves daily, keep charts, key figures, outlook sections updated
Conclusion
The Nasdaq Composite Index (.^IXIC / ^IXIC) remains a cornerstone benchmark for growth and technology-driven equity markets. For traders and investors, understanding its drivers, technical behaviors, and strategic use cases is essential to navigating modern markets.
 XAUT-USD
 AMD
AMD JNJ
JNJ MARA
MARA SHOP
SHOP UNH
UNH BULL
BULL EURUSD=X
 CL=F
CL=F