
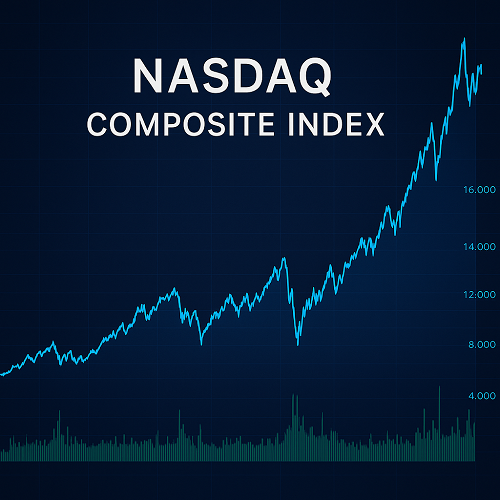
The NASDAQ Composite Index stands as one of the most widely followed equity benchmarks in the world.
While indices such as the S&P 500 and Dow Jones Industrial Average dominate traditional financial media, the NASDAQ Composite provides an unparalleled view into the innovation-driven segment of the U.S. economy — the companies shaping the future of technology, communication, and digital commerce.
Since its inception in 1971, the NASDAQ Composite has evolved from a modest listing of electronic market participants to a global symbol of technological leadership and speculative enthusiasm. For investors, traders, and economists, understanding how this index functions is critical for interpreting shifts in market sentiment and assessing economic health.
History and Evolution of the NASDAQ Composite
Origins of the Index
The NASDAQ (an acronym for National Association of Securities Dealers Automated Quotations) launched in February 1971 as the world’s first electronic stock market. The NASDAQ Composite Index began that same year with a base value of 100, designed to measure the overall performance of all securities listed on the exchange.
At the time, the NASDAQ was seen as a secondary venue compared to the New York Stock Exchange. Yet its electronic trading system and openness to emerging companies laid the foundation for what would become the epicenter of the digital revolution.
Milestones and Growth
- 1980s: The NASDAQ became home to the first generation of personal computing companies — including Apple, Intel, and Microsoft.
- 1990s: The internet boom brought a surge of IPOs, culminating in the dot-com bubble, during which the index rose more than 400% before collapsing in 2000.
- 2000s: The index gradually recovered as a new wave of leaders — Amazon, Google, and others — redefined the digital economy.
- 2010s–2020s: The NASDAQ Composite solidified its position as the global benchmark for technology and growth, frequently outperforming more traditional indices.
Today, the NASDAQ Composite continues to symbolize innovation, risk-taking, and the cyclical nature of technological progress.
Composition and Methodology
Inclusion Criteria
The NASDAQ Composite includes nearly every common stock listed on the NASDAQ Stock Market — over 3,000 securities — making it one of the broadest equity indexes globally.
It comprises:
- Domestic and international common stocks
- Real Estate Investment Trusts (REITs)
- American Depositary Receipts (ADRs)
- Tracking stocks
Excluded are preferred shares, ETFs, warrants, rights, and convertible securities.
Weighting Method
The index is market-capitalization-weighted, meaning each constituent’s weight is determined by its total market value (share price × shares outstanding).
As a result, large-cap companies exert an outsized impact on the index’s movements. For instance, a 2% move in Apple or Microsoft may influence the index more than dozens of smaller firms combined.
Sector Representation
While often viewed as a “technology index,” the NASDAQ Composite spans multiple sectors:
- Information Technology (≈50%)
- Communication Services (≈15%)
- Consumer Discretionary (≈15%)
- Health Care (≈10%)
- Financials and Industrials (≈10% combined)
This composition means the index not only captures tech sentiment but also broader trends in innovation, consumer behavior, and corporate growth.
How the NASDAQ Composite Differs from Other Indexes
NASDAQ Composite vs NASDAQ-100
- NASDAQ Composite: Includes all NASDAQ-listed equities (~3,000+).
- NASDAQ-100: A subset of the largest 100 non-financial companies on the NASDAQ, often used for ETF tracking (e.g., QQQ).
NASDAQ Composite vs S&P 500
- The S&P 500 tracks 500 large U.S. corporations across all exchanges, making it a diversified measure of corporate America.
- The NASDAQ Composite, by contrast, is more growth-oriented, with higher exposure to tech, biotech, and innovation sectors.
- This difference explains why the NASDAQ tends to outperform in bull markets but may experience deeper drawdowns during downturns.
Historical Performance and Market Cycles
The Dot-Com Boom and Bust (1995–2002)
Between 1995 and March 2000, the NASDAQ Composite skyrocketed from around 750 points to over 5,000, fueled by internet optimism and speculative fervor.
When the bubble burst, the index lost nearly 80% of its value, bottoming near 1,100 by 2002. This period remains a textbook case of irrational exuberance and market re-pricing.
Recovery and the Tech Renaissance (2009–2020)
After the 2008 Global Financial Crisis, a new generation of tech giants — Apple, Amazon, Alphabet, and Tesla — drove the index to record highs. By late 2020, amid pandemic-era digital acceleration, the NASDAQ surpassed 12,000 points, demonstrating the enduring strength of the tech sector.
Resilience and Innovation
Despite volatility, the NASDAQ Composite has historically delivered higher long-term returns than most major benchmarks, rewarding investors who embrace innovation and tolerate risk. Its history underscores the cyclical yet transformative nature of technology investment.
Market Dynamics and What the NASDAQ Represents
Indicator of Innovation
The NASDAQ Composite acts as a proxy for global innovation, tracking sectors where future productivity gains are born — from semiconductors and cloud computing to biotechnology and artificial intelligence.
Sentiment Gauge
Because tech stocks are sensitive to interest rates, valuations, and investor psychology, the index often serves as a leading indicator of market sentiment. Rising NASDAQ levels typically signal investor confidence, while steep declines may warn of tightening liquidity or economic slowdown.
Global Correlations
The index also influences — and is influenced by — other asset classes:
- Forex: A strong NASDAQ often coincides with U.S. dollar strength during growth cycles.
- Crypto: Bitcoin and Ethereum have shown rising correlations with NASDAQ tech stocks, reflecting shared speculative behavior and risk appetite.
- Commodities: Periods of tech expansion frequently align with subdued commodity prices, as capital flows toward growth rather than hard assets.
Interpreting the NASDAQ for Traders and Investors
Long-Term Investors
For investors with a multi-year horizon, the NASDAQ Composite offers exposure to the most dynamic sectors of the economy. However, due to its concentration in growth stocks, volatility management and diversification are essential.
Active Traders
Short-term traders monitor NASDAQ momentum, breadth indicators, and relative strength versus other indices to anticipate sector rotations or risk-on/risk-off shifts.
Technical tools such as the NASDAQ Advance-Decline Line, Relative Strength Index (RSI), and moving average crossovers help gauge participation and momentum.
Institutional and Macro Analysts
Professionals use the NASDAQ Composite as a macro barometer, correlating its trends with GDP growth, interest rate cycles, and innovation spending.
Its trajectory can influence policy debates, capital allocation, and corporate valuations worldwide.
Practical Tools and Data Sources
Accessing NASDAQ Data
- FRED (Federal Reserve Economic Data) — Series code:
NASDAQCOM. Provides historical daily closing values, easily downloadable for research or charting. - NASDAQ Data Link / Exchange Feeds — Offers real-time and intraday data.
- Bloomberg, Refinitiv, and Yahoo Finance — Common sources for advanced analytics and comparison metrics.
Using Data for Analysis
Traders can download the index series into Excel, Python, or R to calculate:
- Rolling volatility
- Drawdowns and recovery periods
- Correlation matrices with currencies, commodities, or crypto assets
- Performance attribution by sector or time period
Integrating NASDAQ data into dashboards or machine-learning models allows professionals to quantify sentiment and test trading hypotheses.
Strategic Insights: What Drives the NASDAQ Composite
- Monetary Policy: Lower interest rates typically benefit growth stocks through discounted cash-flow effects.
- Innovation Cycle: Periods of breakthrough technologies — AI, cloud computing, EVs — fuel capital inflows.
- Earnings Growth: The collective profitability of NASDAQ firms drives long-term returns.
- Investor Psychology: Momentum and narrative play large roles; speculative phases can amplify both gains and losses.
- Global Liquidity: Cross-border capital flows and institutional positioning often shape short-term index behavior.
Risks and Limitations
While the NASDAQ Composite’s history of innovation is unmatched, it carries certain structural risks:
- Concentration: A handful of mega-cap stocks dominate the index’s weighting.
- Volatility: Tech valuations can fluctuate sharply based on growth expectations.
- Interest-Rate Sensitivity: Rising yields tend to pressure future earnings estimates.
- Speculative Excess: Retail participation and algorithmic trading can amplify moves.
Investors must balance enthusiasm for innovation with discipline in valuation and risk control.
Conclusion
The NASDAQ Composite Index is far more than a number flashing across financial screens — it is a real-time reflection of global innovation, investor psychology, and technological progress.
Its evolution from a small electronic marketplace to a central pillar of global finance mirrors the transformation of the modern economy itself.
Whether you’re an investor seeking long-term growth or a trader analyzing short-term sentiment, understanding the NASDAQ Composite provides a strategic edge. It encapsulates the rhythm of the innovation economy — cyclical, volatile, and relentlessly forward-looking.
In mastering its history, structure, and behavior, you gain not only insight into market trends but also a deeper appreciation of how human creativity, risk-taking, and technology continually reshape the financial landscape.
 XAUT-USD
 AMD
AMD JNJ
JNJ MARA
MARA SHOP
SHOP UNH
UNH BULL
BULL EURUSD=X
 CL=F
CL=F