Broadcom Inc. (NASDAQ: AVGO) has emerged as one of the tech industry’s powerhouses — not just in semiconductors, but increasingly in infrastructure software and custom AI hardware. Driven by strong demand for networking, AI accelerators, and data-center solutions, Broadcom has produced strong growth in revenue, margins, and free cash flow. That said, its lofty valuation, debt levels, and competition from Nvidia, AMD, and others make it a stock with high upside but also material risks.
This article aims to give you:
- A full picture of where Broadcom stands now
- What may drive it higher (or hold it back)
- How its valuation measures up
- Scenarios & key metrics to watch
Company Profile & Business Segments
- History: Broadcom, formerly Avago Technologies, merged with Broadcom Corporation in 2016, and has since expanded via acquisitions including Brocade, CA Technologies, VMware (completed late 2023) and others.
- Segments:
- Semiconductor Solutions — networking, broadband, storage, wireless, industrial chips, custom ASICs (especially for AI/data centers).
- Infrastructure Software — software for virtualization, security, enterprise-grade services (after VMware acquisition).
- Geography & Clients: Broadcom serves hyperscalers, cloud providers, enterprise customers, telecom operators, device makers (e.g. for wireless, broadband). AI demand is pushing custom silicon and networking.
Recent Financial Performance
Here are key recent results and trends (Fiscal Year ends in November, unless stated otherwise). Data mostly from latest filings and market-analysis summaries.
| Metric | FY 2024 | FY 2023 | Year-over-Year Change / Notes |
|---|---|---|---|
| Revenue | ~ $51.57 B | ~$35.82 B | ~ +44% YoY; strong growth driven by semiconductors & AI demand |
| Gross Profit | ~$32.51 B | ~$24.69 B | Maintained high gross margin (~75-77%) over recent years |
| Operating Income | ~$13.46 B | ~$16.21 B | Slight decline in operating income; pressure from costs / segment margin shifts |
| Net Income | ~$5.89 B | ~$14.08 B | Sharp drop year over year (due to one-off items, expenses, perhaps amortization or interest costs) |
| Free Cash Flow | ~$19.41 B | ~$17.63 B | Strong cash generation remains a hallmark; margin remains healthy |
Other metrics:
- Debt vs Equity / Balance Sheet: Total debt ~ $67-68B in 2024; cash & short-term investments ~$9–14B.
- Profitability Ratios: Return on Equity (ROE) around 13-27% range depending on year; margins strong in gross & EBITDA terms, somewhat more volatile in net income.
Trends to note:
- Rapid revenue growth driven by AI/networking/demand for custom ASICs and data center infrastructure.
- Operating margins impacted somewhat by cost pressures (R&D, SG&A, integration costs, interest).
- Cash flow remains robust — supports dividend, buybacks, debt servicing.
Growth Drivers & Strategic Catalysts
What could drive Broadcom’s performance upward from here? Several strong tailwinds:
AI & Custom Silicon Boom
Broadcom is increasingly getting contracts for custom AI chips / ASICs / XPUs. With AI demand exploding from hyperscalers and data centers, Broadcom is positioning as an alternative or complement to Nvidia.
Networking & Data Infrastructure
AI workloads need fast networking, high bandwidth, low latency. Broadcom’s networking products (Ethernet, switches, interconnects) are crucial. The increased demand for AI inference in cloud and enterprise will push networking CapEx.
Software & Acquisitions
VMware and infrastructure software offerings add recurring revenue, greater margins, and diversification away from pure hardware cycles. Also aid in value stacking (software + hardware).
Strong Free Cash Flow Enables Capital Deployment
The cash generation allows for dividends, share buybacks, and debt reduction — all boosting shareholder returns. It also gives room to invest into R&D, new product lines.
Macro Trends Favoring Everything “AI-Up”
AI adoption, cloud migration, edge computing, 5G/6G, bandwidth hungry apps — these are all multi-year trends that favor Broadcom’s segments.
Valuation Potential if Execution Holds
While the stock is already richly valued, if growth continues and profit margins hold, investors may assign premium valuation multiples.
Competitive Landscape & Threats
Even with many positives, Broadcom faces several challenges:
| Competitor | What They Bring | Threats / Weaknesses Relative to Broadcom |
|---|---|---|
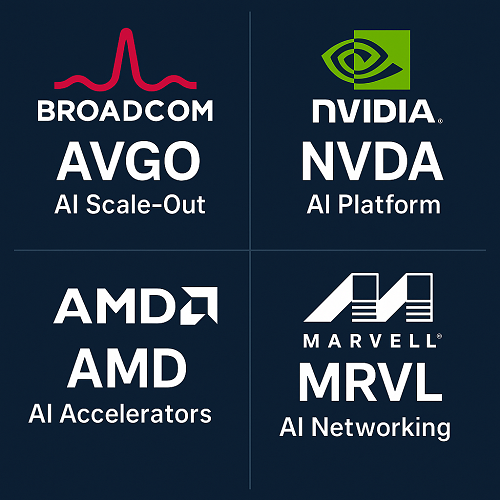
| Nvidia | Leader in GPUs, AI training, massive install base, software ecosystem (CUDA etc.) | Broadcom may be able to capture share in specific niches (custom ASICs, inference) but can’t easily displace in training; software ecosystem still weaker. |
| AMD | Strong GPU & data center presence; growing in inference/AI segments | Broadcom could undercut in some areas where custom designs are viable, but AMD has strong R&D and existing cloud relationships. |
| Intel / TSMC / other foundry alliances | Manufacturing capacity, scale, existing relationships | Broadcom is fabless for many components; dependency on foundries exposes risk (supply chain, costs). |
| Others (e.g. Marvell, Broadcom’s fragmenting peers, open-source solutions) | Niche strengths, lower cost, specialization | Broadcom must keep innovating, controlling costs and ensuring product differentiation. |
Other risks:
- Valuation is high; market expectations baked in. Any miss risks sharp corrections.
- Interest rates / macro & supply chain risks can eat margins.
- Regulatory and geopolitical risk, especially in semis (Taiwan, China, trade restrictions).
Valuation & Key Ratios
Broadcom’s valuation metrics are currently rich. Here’s how it stacks up:
| Valuation Metric | Current / Recent Value | How it Compares to Peers or Historical Levels |
|---|---|---|
| P/E (Trailing / Forward) | Trailing P/E: very high (in the 90-100× range) Forward P/E: lower but still elevated (40-50× estimated) | Much higher than many semiconductor peers (which may trade in 20-40× depending on growth); implies strong growth expectations are already priced in. |
| EV/EBITDA, EV/Sales, P/FCF | EV/EBITDA and EV/Sales are also high. P/FCF elevated. | This suggests limited margin for error. If cash flow or growth slips, valuation compression likely. |
| Margin Profile (Gross, Operating, EBITDA) | Excellent gross margins (~75-77%), strong EBITDA margins; operating & net margins more volatile due to costs and one-off items. | Comparable or slightly ahead of many peers in gross and EBITDA, but net income margin is where Broadcom must maintain discipline. |
| Debt Levels & Leverage | Significant debt but manageable given cash flow; Debt/EBITDA, Debt/Equity ratios show elevated leverage but not extreme (depending on peer set). | Investors will monitor interest cost / debt service as rates rise or if cash flow dips. |
Price Technicals & Trading Levels
While this article doesn’t include live charts, here are notable technical/price levels & patterns based on recent reporting and analyst commentary:
- Recent Price Range & Volatility: The stock has seen a large run-up recently, partly fueled by AI optimism and large custom ASIC orders.
- Support Levels: Analysts frequently cite strong support around $250 (from past consolidation zones) and possibly $185 in more severe pullback scenarios.
- Resistance / Upside Targets: Given current momentum, some projection targets are being floated in the $600-range within 12-24 months under bullish scenarios.
- Overbought Conditions: Some technical indicators (e.g. RSI) suggest overbought short term; possible consolidation or pullback before next leg up.
Risks & What to Monitor
To manage risk, investors should watch closely:
- Execution risk: Delivery of AI/ASIC contracts, meeting performance metrics, yield, and supply chain constraints.
- Margin compression: Rising input costs, labor, shipping, tariffs, power, etc. If cost growth outpaces pricing ability, margins could erode.
- Regulatory / Geo-political risk: Export restrictions (especially if selling into or source from China, Taiwan, etc.), trade policy, competition policy (monopolistic practices).
- Valuation risk / macro pullback: A high multiple exposes Broadcom to sharp downside if growth slows or if interest rates rise.
- Currency risk: For overseas operations or sales.
Analyst Consensus & Market Sentiment
- Price targets: Analyst estimates vary, with many placing 12-month targets in the $300-$400+ range for now; some more bullish ones target higher in longer term if growth accelerates.
- Sentiment: Strong among institutional investors, especially those focused on AI & infrastructure. The stock is increasingly cited as one of the “Magnificent Eight” tech/AI plays.
- Recent news catalysts include large new AI orders, ties of executive compensation to AI revenue, record revenues in AI-related segments.
Long-Term Outlook & Scenarios
Here are possible paths forward (3-5 years) depending on how well Broadcom capitalizes on its strengths and navigates risks:
| Scenario | Key Assumptions | Potential Outcomes |
|---|---|---|
| Base Case | AI demand continues, Broadcom wins multiple custom ASIC orders, maintains margins, moderate macro headwinds | Revenue +20-30% CAGR; Free cash flow remains strong; stock trades at high multiples but returns from dividends + buybacks; price in $400-$600 range depending on execution. |
| Bull Case | Aggressive expansion in AI hardware, more software monetization, dominant position in custom silicon, favorable regulatory & supply chain environment | Much higher growth; valuation multiples expand; possible upside well above $600+, particularly if growth forecasts exceed expectations. |
| Bear / Risk Case | AI demand stutters, competitive pressure from Nvidia/AMD intensifies, costs rise, margins fall, macro conditions worsen | Growth slows or reverses; margins compressed; valuation drops; potential pullback toward $200-$250 or lower in a severe scenario. |
Frequently Asked Questions (FAQ)
What is Broadcom’s exposure to AI, and how significant is it for future revenues?
A: Very significant. Broadcom earns increasing revenue from AI-related products: custom ASICs, networking components for data centers, and infrastructure to support inference/training workloads. Recent deals (e.g., large custom chips with cloud/hyperscaler clients) are being reported, which could materially bump up the AI portion of revenue. If management meets its AI revenue targets, this could be the most important growth lever going forward.
How does Broadcom’s debt affect its valuation and risk profile?
A: The debt is sizeable, but Broadcom generates very strong free cash flows, which helps service debt and fund other initiatives. Still, higher interest rates, or any drop in cash flow, increases risk. Also, debt increases dependency on good capital allocation (reducing debt, avoiding overpayment for acquisitions, balancing buybacks/dividends). Debt ratios (Debt/EBITDA, Debt/Equity) are elevated vs historical norms, so investors should monitor interest expense and maturities.
Is Broadcom overvalued at current multiples?
A: Arguably yes, especially on trailing P/E and EV/EBITDA. Much of its valuation relies on continued growth, especially from AI. If growth slows or costs rise, there could be a valuation correction. However, if guidance and execution are strong, the premium could be justified. Forward multiples are less extreme but still demand high performance.
How does Broadcom compare vs Nvidia for AI investment?
A: Nvidia remains the standard for AI training, software ecosystem, developer tools. Broadcom is more of a complement: strong in networking, custom silicon, and serving as an alternative in certain inference and acceleration contexts. If one believes AI adoption scales exponentially and organizations need multiple providers, Broadcom has space. But competing with Nvidia’s ecosystem is a big challenge.
Is the dividend yield attractive?
A: Broadcom does pay dividends, but the yield is moderate. Part of its appeal is the combination of growth + income + buybacks. Again, what matters is whether free cash flow remains robust and whether the company continues to return capital without sacrificing growth.
Conclusion
Broadcom (AVGO) is a compelling company in the current tech landscape. Its position in semiconductors, networking, and infrastructure software gives it strong exposure to secular trends around AI, cloud, and data centers. The financials are solid, especially on revenue growth and cash flow. That said, the stock is already richly priced, and expectations are high. For the investor, this means:
- If you believe Broadcom can deliver strong AI-related growth, maintain margins, manage debt, and navigate competitive pressures, the upside could be large.
- But margin slips, macro headwinds, or competitive missteps could lead to sharp downside.
Actionable takeaway: If buying, it may make sense to scale in (i.e. partial position now, adding on dips), keep an eye on upcoming earnings/cash flow reports for signs of margin pressure, and monitor competitive moves, especially from Nvidia and AMD. Investors should also keep a close watch on valuation multiples — they leave little room for error.


 XAUT-USD
 AMD
AMD MARA
MARA SHOP
SHOP BULL
BULL CL=F
CL=F