
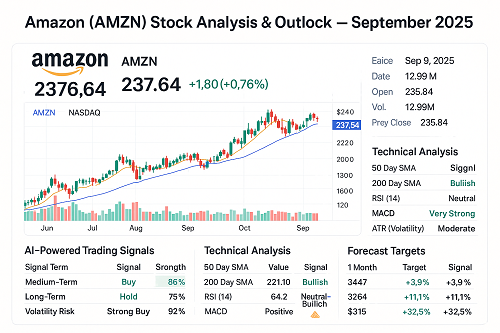
Amazon (AMZN) Stock Snapshot
| Metric | Value (as of Sept 9, 2025) |
|---|---|
| Stock Symbol | AMZN |
| Exchange | NASDAQ |
| Current Price | $237.64 |
| Day Change | +$1.80 (+0.76%) |
| Intraday Range | $235.13 – $237.88 |
| 52-Week Range | $168.67 – $241.56 |
| Market Cap | $2.44 Trillion |
| P/E Ratio (TTM) | 58.3 |
| EPS (TTM) | $4.07 |
| Volume | 13.0M |
| Avg. Volume | 46.8M |
| Dividend | None |
| Next Earnings Date | October 25, 2025 |
Quick Take: Amazon continues to dominate global e-commerce and cloud computing, with AWS contributing ~19% of revenue but 62% of operating profits. The stock has outperformed the S&P 500 by nearly +27% YTD.
Company Overview
Founded by Jeff Bezos in 1994, Amazon has evolved from an online bookstore into a $2.4 trillion tech giant spanning:
- E-commerce – Retail dominance across 20+ countries.
- AWS (Amazon Web Services) – The world’s leading cloud platform.
- Advertising – Amazon Ads generates $55B+ annually.
- Prime Ecosystem – Over 240M Prime subscribers worldwide.
- AI & Robotics – Investment in generative AI, Alexa, and warehouse automation.
Amazon operates in over 190 countries, with Andy Jassy as CEO since 2021.
Recent Stock Performance
YTD Performance
- Amazon stock +27.3% YTD vs. S&P 500 +14.6%.
- Q2 2025 earnings beat expectations:
- Revenue: $165.7B (+12% YoY)
- AWS Revenue: $30.1B (+18% YoY)
- Operating Income: $22.6B (+42% YoY)
Key Catalysts Driving AMZN’s Rally
- AWS dominance and accelerating enterprise AI adoption.
- Explosive growth in Amazon Ads (+24% YoY).
- Improved cost efficiency in logistics and fulfillment.
- Stock buybacks: Amazon repurchased $10B+ shares in 2025.
Amazon’s Financial Health & Valuation
Key Valuation Metrics
| Metric | Amazon (AMZN) | Alphabet (GOOG) | Meta (META) |
|---|---|---|---|
| Market Cap | $2.44T | $2.08T | $1.10T |
| P/E (TTM) | 58.3 | 26.7 | 29.3 |
| PEG Ratio | 1.42 | 1.32 | 1.29 |
| Price/Sales | 3.2 | 5.1 | 4.8 |
| Price/Book | 7.5 | 5.4 | 6.1 |
Insight: Amazon trades at a premium P/E, justified by faster earnings growth driven by AWS, Prime, and advertising.
Revenue Breakdown (Q2 2025)
| Segment | Revenue | YoY Growth |
|---|---|---|
| North America Retail | $85.4B | +9% |
| International Retail | $25.2B | +7% |
| AWS Cloud Services | $30.1B | +18% |
| Advertising | $15.2B | +24% |
| Other Bets (Robotics, AI, Devices) | $9.8B | +11% |
Analyst Ratings & Price Forecasts
| Firm | Rating | Price Target | Upside Potential |
|---|---|---|---|
| Goldman Sachs | Buy | $275 | +16% |
| Morgan Stanley | Overweight | $260 | +9.5% |
| JP Morgan | Strong Buy | $280 | +18% |
| Barclays | Equal Weight | $240 | +1% |
| Average Consensus | Buy | $264 | +11% |
Analyst Consensus:
Out of 48 analysts, 38 rate AMZN a Buy, 8 Hold, and 2 Sell.
Technical Analysis & Trading Levels
| Indicator | Value | Signal |
|---|---|---|
| 50-Day MA | $221.10 | Bullish |
| 200-Day MA | $198.35 | Bullish |
| RSI (14-day) | 64.2 | Neutral-Bullish |
| MACD | Positive | Buy Signal |
| Support Levels | $232 / $218 | |
| Resistance Levels | $241 / $258 |
Trading Insight: A breakout above $241 could trigger a rally toward $260. Conversely, a dip below $232 may indicate short-term weakness.
ETFs & Institutional Holdings
Top ETFs with high AMZN exposure:
| ETF Name | Weight |
|---|---|
| Invesco QQQ Trust (QQQ) | 7.4% |
| Vanguard Growth ETF (VUG) | 9.8% |
| SPDR S&P 500 ETF (SPY) | 5.1% |
| ARK Innovation ETF (ARKK) | 6.3% |
| ProShares UltraPro QQQ (TQQQ) | 8.2% |
Institutional ownership stands at 61%, with Vanguard and BlackRock leading.
Risks & Challenges
- Regulatory Risks – Antitrust scrutiny in the U.S. & EU.
- Rising Competition – From Walmart, Shopify, Google Cloud.
- Economic Slowdown – Consumer spending sensitivity.
- AWS Dependency – Cloud slowdown could pressure margins.
- Valuation Premium – High P/E makes AMZN vulnerable during market corrections.
Future Outlook
Short-Term (3-6 Months)
- Q3 2025 earnings expected to beat consensus.
- AWS growth to accelerate via AI services.
- Resistance at $241 remains key breakout zone.
Mid-Term (6-18 Months)
- Prime Video expansion and advertising growth could push margins higher.
- Potential for stock buybacks and dividend initiation in 2026.
Long-Term (2-5 Years)
- AWS + AI + Ads = Long-term compounding growth.
- Analysts project Amazon reaching $350–$400 by 2028.
FAQs
Is Amazon stock a buy right now?
Yes, analysts maintain a “Buy” consensus with an 11% upside based on average price targets.
Does Amazon pay dividends?
No. Instead, Amazon reinvests earnings into growth and stock buybacks.
What drives Amazon’s profits most?
AWS generates ~19% of revenue but 62% of operating income.
How does Amazon compare to Google & Meta?
Amazon trades at a higher P/E but enjoys faster AWS-driven earnings growth.
Conclusion
Amazon remains one of the strongest growth stories in big tech. With expanding margins, dominant cloud positioning, and accelerating advertising revenue, AMZN continues to outperform broader markets.
Investor Takeaway:
- For traders → Watch the $241 resistance breakout.
- For long-term investors → Accumulate on dips below $230.
- Price Target (12 months): $264
- Upside Potential: +11%
 XAUT-USD
 AMD
AMD JNJ
JNJ MARA
MARA SHOP
SHOP UNH
UNH BULL
BULL EURUSD=X
 CL=F
CL=F