
In global markets, volatility indices serve as “fear gauges”—barometers of investor anxiety, forward-looking expectations, and implied market turbulence. While the U.S. VIX is widely known and tracked, Japan’s counterpart—VXJ (sometimes called JPVIX, Japan Volatility Index)—is less commonly discussed, yet offers unique insights into the Japanese stock market and Japan’s equity risk premium.
This article offers a comprehensive deep dive into VXJ: its construction, historical behavior, interpretation for traders, relationship to Japan’s equity markets, and practical strategies for incorporating it into risk management or trading systems.
What Is VXJ (Volatility Index Japan)?
Definition & Purpose
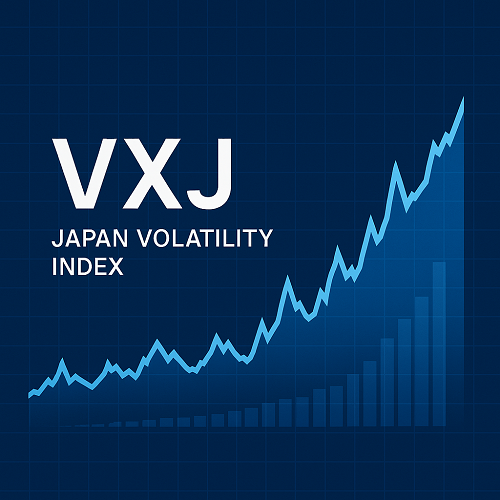
VXJ (Volatility Index Japan) is an implied-volatility index computed from options on the Nikkei 225 index. It represents the market’s expectation of the magnitude of price fluctuations over the next 30 days. In effect, it is Japan’s version of the VIX (Cboe Volatility Index).
The index is maintained by a research group (MMDS, Osaka University) using daily option-price data from Nikkei index options.
VXJ is not a tradable security by itself (i.e. you can’t directly buy “VXJ”), but it provides a forward-looking volatility forecast, much like the U.S. VIX.
Calculation Methodology
- The VXJ is constructed by aggregating information from Nikkei 225 index options across different strikes, weighted to produce an implied volatility measure over the next 30 days.
- Because Japan’s equity derivatives market is less liquid than in the U.S., data and estimation techniques may differ (e.g. interpolation, extrapolation of option strikes) and be more sensitive to noise.
- The index is updated daily and is widely published by the VXJ research team via the MMDS website.
The Japanese-language description states:
“Volatility Index Japan (VXJ) uses daily data of Nikkei 225 options, and forecasts how much the market will fluctuate over the next month… this numeric value has no direct meaning as an asset price, but functions as a reference index for dynamic hedging, risk management, and macro reaction assessments.”
In other words, VXJ is a model-derived synthetic indicator rather than a traded instrument.
Current Values & Recent Trends
As of early October 2025:
- VXJ is trading around 24.84, down 0.45 (−1.78 %) from the prior session.
- Over the past four weeks, VXJ has declined ~4.06 % and over 12 months, it’s down ~1.00 %.
- Historical data from Seeking Alpha shows daily closing prices, with occasional spikes and mean reversion behavior.
- According to the Investing site, the 52-week range is approximately 18.31 to 62.46.
These numbers suggest that volatility in Japan has fluctuated significantly, with periods of elevated fear or stress, but as of now it sits in a moderate range.
The VXJ research group (MMDS) also publishes the full time series of VXJ and notes that it responds sensitively to downturns in the Nikkei 225. The time-series shows sharp jumps during stress episodes and more gradual pulls during calmer regimes.
Why VXJ Matters: Economic & Trading Significance
As a Fear Gauge
VXJ captures implied volatility, which is influenced by:
- Market sentiment: rising VXJ often correlates with negative equity returns (investors bid for protective options).
- Risk aversion: during crises, implied volatility tends to spike, reflecting uncertainty.
- Forward-looking expectations: unlike realized volatility, VXJ captures expectations over the next 30 days, embedding information about upcoming events, macro risk, policy surprises, or external shocks.
Relationship with Nikkei 225
Empirically:
- VXJ often spikes when the Nikkei 225 declines sharply.
- Conversely, when the index rallies, VXJ tends to contract (though often with lag or lower amplitude).
- The asymmetric response reflects investor demand for downside protection over upside insurance.
- Researchers have used VXJ in volatility forecasting models for Japanese equities (i.e. to predict next-day realized volatility).
- For example, academic work on volatility forecast combination suggests implied volatility (like VXJ) improves predictions over models using only historical volatility.
Comparison to U.S. VIX
VXJ is analogous to the U.S. VIX, though with notable differences:
- Liquidity: The options market in Japan is thinner, making VXJ more susceptible to pricing noise.
- Market structure: Regulatory or structural differences can influence how volatility is priced in Japan vs. U.S.
- Volatility regimes: Japan’s economic dynamics (e.g. interest rates, yen fluctuations, structural stagnation) may lead to different baseline volatility levels and responses.
Use in Risk Management & Hedging
While VXJ itself is non-tradable, it can be used for:
- Volatility overlays: adjusting portfolio exposures when implied vol is high (i.e. scaling back risk)
- Stress testing: calibrating portfolio shocks based on volatility shifts
- Pairing with realized volatility: as a deviation measure (implied vs realized) for signal generation
- Option strategies: if one trades Nikkei options or volatility derivatives, using VXJ as a benchmark or sentiment metric
Historical Patterns & Behavior
Typical Behavior & Reversion
- VXJ tends to mean-revert—extreme spikes are followed by declines, and low levels tend to drift upward in anticipation of shocks.
- During crisis periods (global crashes, geopolitical shocks, large yen moves), VXJ has spiked into the 50–70 range. Benzinga reported that at one point the index reached 70, nearing its highest levels since 2008.
- However, those spikes remain rare; much of the time, it oscillates in a band between 15 and 40 (depending on regime) in more stable years.
Statistical Behavior
- The distribution is positively skewed, with infrequent but large jumps.
- Autocorrelation in daily VXJ returns tends to be low, but levels show persistence (i.e. variances cluster).
- The spread between implied (VXJ) and realized volatility (historical standard deviation of Nikkei returns) can produce signals: large positive spreads may imply overpricing of options or market stress expectations.
Example: VXJ in Past Crises
- In March 2011 (following the Tōhoku earthquake/tsunami/nuclear crisis), VXJ reportedly spiked noticeably.
- In 2008 (global financial crisis), peak implied volatilities approached extreme levels in Japan, as global risk spread to all markets.
These episodes highlight how VXJ functions as an early warning metric for stress.
How to Use VXJ in Trading & Strategy
Though VXJ is non-tradable, it can still inform strategy decisions. Below are practical approaches:
1. Volatility Regime Filter
Use VXJ to define “high-volatility” vs “low-volatility” regimes:
- Thresholds: e.g. VXJ > 40 → high-vol; 20 < VXJ < 40 → medium; VXJ < 20 → low-vol
- You might adjust position sizes, leverage, or stop-loss buffers based on regime.
2. Implied vs Realized Spread Signal
Define a spread = VXJ – realized volatility (e.g. 20-day historical vol).
- Positive large spread may indicate market overpricing of volatility, possibly anticipating mean reversion in VXJ or a calm period
- Negative spread (realized > implied) may suggest that volatility has already surged more than expected—could signal persistently elevated volatility or a transition.
3. Pair Trade: Nikkei vs Volatility
When VXJ spikes and Nikkei falls, consider short-term mean reversion trades on the index (if you trade Nikkei derivatives). VXJ can act as a contrarian sentiment metric.
4. Options Strategy Calibration
If trading Nikkei options or volatility derivatives (where available), use VXJ as a volatility benchmark to:
- Price relative option premiums
- Determine whether implied volatility is cheap or expensive relative to VXJ
- Design straddle/strangle width around expected volatility levels
5. Risk-Off Timing Tool
VXJ spikes can suggest incoming market turbulence. One can reduce equity exposure or increase hedges (e.g. protective puts) when VXJ breaches defined thresholds.
Caveats & Risks
- VXJ is model-based and depends heavily on option data quality; in thin markets, its pricing can be noisy.
- During extreme crises, implied volatility measures may understate true potential volatility (liquidity drying up).
- Because VXJ is non-tradable, it cannot be used as a hedge directly—only as a signal or overlay.
Interpretation and Tips for Traders & Analysts
| Use Case | Interpretation | Actionable Insight |
|---|---|---|
| Rising VXJ | Market expects turbulence | Caution: consider de-risking or hedging |
| Falling VXJ | Risk appetite is returning | Opportunity: increase exposure, but beware of false calm |
| VXJ >> Realized Volatility | Implied vol is high relative to realized | Possibly overpriced options or upcoming calm |
| VXJ << Realized Volatility | Realized vol surprising market | Possible further volatility or correction |
| Spike events | Stress episodes | Use as trailing stop / risk alert |
Tips for Effective Use:
- Combine VXJ with other indicators (momentum, trend, macro signals) — avoid sole reliance.
- Smooth VXJ (e.g. 5-day moving average) to reduce noise.
- Monitor option market liquidity — in thin zones, signals may be less reliable.
- Use backtesting to validate how VXJ thresholds operate with your strategies in Nikkei derivatives.
- Keep macro overlays (yen moves, Japanese interest rates, global volatility) to contextualize VXJ shifts.
Challenges, Limitations & Considerations
Data Transparency & Availability
Because VXJ is a research index (not a product of the Japan Exchange explicitly), some users may have difficulty accessing real-time or high-frequency data across all platforms.
Liquidity & Option Market Depth
Thin trading in out-of-money Nikkei options (especially for distant strikes or expirations) may lead to noisy implied volatility estimates, affecting VXJ’s accuracy.
Non-Tradability
VXJ is not directly investible. Traders must use proxies (e.g. options on Nikkei, volatility derivatives if available) and treat VXJ as a signal rather than an asset.
Structural Differences vs. U.S. Markets
Sovereign yield curves, monetary policy, macro regime, yen dynamics, and regulatory environment differ from the U.S.—so VXJ’s behavior may diverge from what one expects from U.S. volatility analogs.
FAQ (Frequently Asked Questions)
Q1: What is the ticker symbol for VXJ?
VXJ is commonly referred to in indexes as VXJ:IND or JPVIX on data platforms.
Q2: Is VXJ a tradable instrument?
No, VXJ is a synthetic implied-volatility index and cannot be bought or sold. It functions as a benchmark and signal metric.
Q3: Where can I see historical VXJ data?
You can access daily time series on the MMDS VXJ site (Osaka University) and via platforms like Seeking Alpha.
Q4: How is VXJ computed?
VXJ is computed from Nikkei 225 option prices across strikes, constructing a 30-day implied volatility measure via weighting techniques.
Q5: How to use VXJ in strategy?
Use it as a regime filter, spread signal (implied vs realized), overlay for risk management, or as a volatility benchmark when trading Nikkei derivatives.
Conclusion & Future Outlook
VXJ fills an important role in Japanese markets: as the de facto volatility index reflecting implied future risk in the Nikkei 225. While less prominent than the U.S. VIX, it offers valuable signals for equity traders, derivatives strategists, and risk managers focused on Japan.
By combining VXJ with realized volatility, macro indicators, trend signals, and proper risk controls, you can enhance your timing, manage tail risks, and adjust exposures proactively.
As Japanese markets evolve (increasing derivatives liquidity, new volatility products, greater integration with global flows), VXJ’s practical utility and market adoption may further grow. For now, understanding and leveraging VXJ gives you a vantage into the Japanese volatility regime that few international traders fully exploit.
 XAUT-USD
 AMD
AMD JNJ
JNJ MARA
MARA SHOP
SHOP UNH
UNH BULL
BULL EURUSD=X
 CL=F
CL=F