
The Emotional Pulse of the Global Market
Every financial market — from Wall Street to the forex pit to the blockchain — moves on one invisible force: human emotion.
Fear and greed have driven bubbles, crashes, and recoveries throughout history. In 2025, these emotions are not just felt — they’re measured, quantified, and tracked in real time through tools like the Fear and Greed Index.
Whether you’re a stock investor, forex trader, or crypto enthusiast, understanding market sentiment can be the difference between following the herd and anticipating the next move.
This guide explores how fear and greed shape market cycles, how to use sentiment indices to your advantage, and why mastering this psychology is essential for outperforming the crowd.
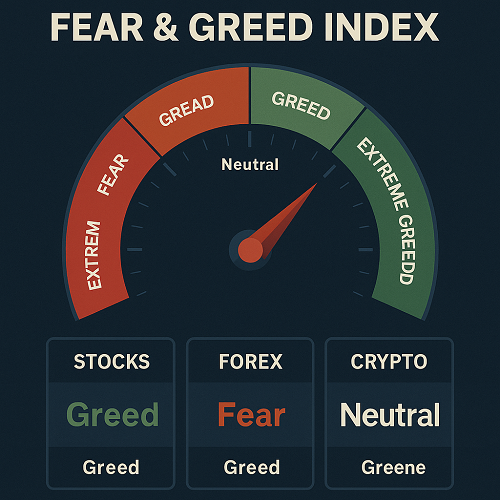
What Is the Fear and Greed Index?
The Fear and Greed Index measures investor sentiment — essentially, how optimistic or pessimistic market participants feel about the future.
Originally popularized by CNN Business, this index analyzes seven key indicators to produce a score between 0 (Extreme Fear) and 100 (Extreme Greed).
When fear dominates, traders sell; when greed takes over, they buy — often irrationally.
The 7 Core Components (CNN Methodology)
| Indicator | What It Measures | Interpretation |
|---|---|---|
| Stock Price Momentum | S&P 500 vs. 125-day moving average | Greed when prices surge above average |
| Stock Price Strength | Number of stocks hitting new highs vs. lows | Greed when highs dominate |
| Stock Price Breadth | Trading volume in advancing vs. declining stocks | Indicates broad market participation |
| Put and Call Options | Options activity as fear/greed proxy | More puts = fear; more calls = greed |
| Junk Bond Demand | Risk appetite in credit markets | High demand = greed |
| Market Volatility (VIX) | Measures fear via volatility | High = fear; low = complacency |
| Safe Haven Demand | Flow into Treasuries vs. stocks | More Treasuries = fear |
🧭 Visualization Placeholder:
(Insert a chart showing CNN Fear & Greed Index historical values from 2008–2025.)
How Fear and Greed Move the Markets
Emotion drives capital allocation. In bull markets, greed blinds rationality — investors chase returns. In bear markets, fear paralyzes them, creating undervalued opportunities.
Let’s look at how this manifests across markets:
1. Stock Markets: Herd Behavior in Action
In equities, greed creates bubbles — think the dot-com boom or the 2021 meme-stock mania.
Fear, meanwhile, triggers panic selling and capitulation phases.
Institutional traders often use sentiment indices contrarianly:
- Extreme greed = potential top
- Extreme fear = potential bottom
Example:
During the COVID-19 crash of March 2020, CNN’s index hit 5 (Extreme Fear). Within weeks, the S&P 500 began its historic recovery.
📊 Insert chart: S&P 500 vs. Fear & Greed Index correlation (2018-2025).
2. Forex Markets: Sentiment vs. Central Bank Policy
In foreign exchange, fear and greed affect currency flows and risk appetite.
- When traders fear global slowdown → money flows into safe-haven currencies like USD, CHF, and JPY.
- When greed returns → capital moves to higher-yielding currencies (AUD, NZD, emerging-market pairs).
Indicators like the CFTC’s Commitment of Traders (COT) reports and global risk indices (e.g., VIX, MOVE) complement the sentiment picture.
Example:
In 2022, as inflation fears rose, traders flooded into the U.S. dollar — not out of greed, but fear of systemic uncertainty. The dollar index (DXY) surged, while risk currencies plunged.
3. Crypto Markets: Fear and Greed on Steroids
No market reacts to emotion like crypto. The Crypto Fear & Greed Index (by Alternative.me) captures this volatility daily, combining:
- Volatility & volume
- Social media sentiment
- Google Trends data
- Dominance (Bitcoin vs. altcoins)
Because crypto lacks traditional valuation anchors, sentiment can swing violently — from euphoria to despair — in a matter of hours.
Example:
- In November 2021, the index read Extreme Greed (84) as Bitcoin hit $68,000.
- By June 2022, it plunged to Extreme Fear (9) — right before a 70 % drawdown stabilized.
💹 Insert chart: Bitcoin price vs. Crypto Fear & Greed Index (2020-2025).
How Traders Use the Fear and Greed Index
Professional traders don’t just observe sentiment — they trade against it.
Here’s how you can apply it across markets:
1. As a Contrarian Indicator
Extreme readings often signal market exhaustion.
- Extreme Greed → consider tightening stops or taking profit.
- Extreme Fear → look for reversal signals or long entries.
⚙️ Example Strategy:
- When CNN’s index < 20 → scan for oversold quality stocks using RSI < 30.
- When > 80 → hedge via volatility ETFs or protective puts.
2. Sentiment-Weighted Portfolio Allocation
Diversified portfolios can be adjusted using sentiment:
- Risk-on assets (equities, high-yield FX, crypto) thrive under greed.
- Defensive assets (bonds, gold, USD) perform during fear.
A disciplined trader rebalances positions based on prevailing emotional trends rather than fixed percentages.
3. Combining Technicals and Sentiment
The best results come from merging technicals, fundamentals, and sentiment.
🧠 Example:
- Use Fear & Greed Index to identify sentiment extremes.
- Confirm with technical divergence or support/resistance levels.
- Execute trades with defined risk and asymmetric reward setups.
This synergy minimizes emotional bias — the greatest threat to consistent profitability.
Historical Context: Fear & Greed Through Market Crises
The index doesn’t just measure current conditions — it reflects the market’s collective memory of past trauma and euphoria.
| Year | Event | Fear & Greed Reaction | Market Outcome |
|---|---|---|---|
| 2008 | Global Financial Crisis | Extreme Fear (index < 10) | Market bottomed March 2009 |
| 2016 | Brexit & US Elections | Fear spikes, then greed returns | Volatility surge, short-term opportunity |
| 2020 | COVID Crash | Fear (index 5) | Massive recovery 6 months later |
| 2022 | Inflation & Rate Hikes | Fear dominates | Bear-market rallies |
| 2024–2025 | AI & Tech Boom | Greed resurges | Bubble-like tech valuations |
🧾 Insert visual timeline chart: Major sentiment events 2008–2025.
Limitations of the Fear and Greed Index
While powerful, the index has caveats:
- Lagging nature – Sentiment reacts to price, not vice versa.
- US-centric bias – CNN’s version focuses on American equities.
- Lack of granularity – It doesn’t distinguish sectors or asset classes.
- Overuse risk – If too many traders use it similarly, its contrarian edge erodes.
Hence, it’s best used as a confirmation tool, not a primary trigger.
Advanced Applications for Traders
1. Algorithmic Sentiment Integration
Quantitative traders scrape data from Reddit, Twitter, and Google Trends, feeding sentiment into machine-learning models that forecast volatility.
2. Cross-Market Correlation Studies
Institutional desks map fear/greed readings against correlations between risk assets — e.g., equities vs. crypto or USD/JPY vs. NASDAQ 100.
3. Hedging & Volatility Forecasting
Options traders track sentiment extremes to price implied volatility, using instruments like VIX futures or crypto perpetual funding rates as hedges.
📈 Insert chart placeholder: Correlation between CNN Index, VIX, and BTC volatility.
How to Track Fear and Greed in Real Time
- CNN Business Fear & Greed Index: covers US equities.
- Alternative.me Crypto Index: covers digital assets.
- Sentix & AAII Surveys: measure retail and institutional sentiment globally.
- Google Trends: sentiment proxy via keyword search interest.
- Broker positioning tools: e.g., IG Client Sentiment or OANDA positioning.
Combine these to form a multi-asset sentiment dashboard.
Building a Sentiment-Driven Trading Routine
- Morning: Check CNN/Alternative.me indices.
- Mid-day: Cross-check with volatility metrics (VIX, MOVE, crypto implied vols).
- Evening: Log notes in a sentiment journal — did greed or fear dominate your trades?
- Weekly: Back-test how sentiment readings aligned with key market moves.
🧾 Insert visual: Example of a trader’s weekly sentiment log template.
The Psychology Behind Fear and Greed
Neuroscience shows the amygdala (fear) and nucleus accumbens (reward/greed) dominate financial decision-making.
This is why the same chart pattern can elicit opposite reactions in different phases of the market.
Mastering sentiment isn’t about predicting emotion — it’s about anticipating how others will act under emotion.
Future of Sentiment Analysis (2025 and Beyond)
AI-driven analytics are evolving the classic index.
In 2025, expect:
- Real-time crowd emotion tracking from social media and retail trading data.
- Blockchain-based sentiment oracles feeding DeFi protocols.
- Cross-asset predictive analytics linking stocks, forex, and crypto in unified dashboards.
The new generation of traders will trade emotion as an asset class.
Conclusion: Trade the Crowd, Not With It
The Fear and Greed Index is more than a curiosity — it’s a psychological compass.
Across stocks, forex, and crypto, markets move in cycles of optimism and panic.
By reading sentiment objectively, you position yourself not as a follower of the herd, but as the trader who profits from it.
Use fear as your signal to accumulate.
Use greed as your warning to protect gains.
That’s how disciplined traders turn emotional volatility into consistent opportunity.
FAQs: Fear & Greed Index for Stocks, Forex & Crypto
1. What is a good Fear and Greed Index reading?
A neutral range (40–60) indicates balanced sentiment. Readings above 80 imply greed; below 20 imply fear — often contrarian buy/sell signals.
2. Can I use the CNN index for forex or crypto?
Yes, but complement it with other sentiment tools — CNN’s is equity-focused, while Alternative.me specializes in crypto.
3. Does high greed always mean a crash is coming?
Not immediately. Greed can persist during strong uptrends, but it warns that risk/reward may be skewed.
4. How often should traders check sentiment indices?
Daily for crypto, weekly for equities/forex. Avoid overreacting to single-day changes.
5. Is the Fear and Greed Index reliable for long-term investors?
As a timing tool, yes — especially for identifying extreme emotional points that often coincide with cyclical turning points.
 XAUT-USD
 AMD
AMD JNJ
JNJ MARA
MARA SHOP
SHOP UNH
UNH BULL
BULL EURUSD=X
 CL=F
CL=F