
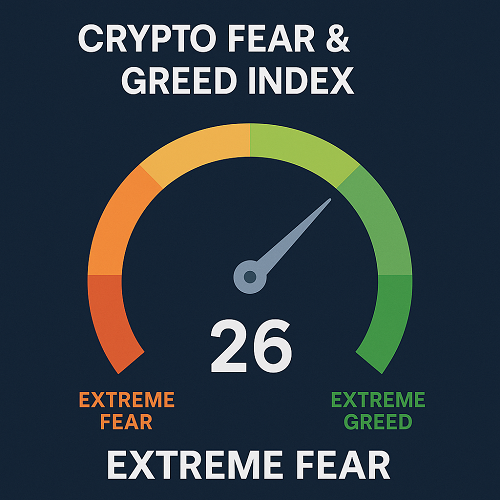
The Crypto Fear & Greed Index is a sentiment gauge created by Alternative.me that measures market emotion primarily around Bitcoin, aggregating multiple inputs (volatility, volume, social media, dominance, and search trends) into one composite score.
The underlying assumption:
- Extreme fear may signal oversold conditions or a buying opportunity
- Extreme greed may indicate the market is overheating and ripe for a correction
Thus, it’s intended as a contrarian sentiment signal, not a predictive oracle.
Current Value & Updates
The index updates daily, giving a snapshot of market sentiment. The website also shows historical values: “Now,” “Yesterday,” “Last week,” “Last month” etc.
Alternative.me also provides an API endpoint (e.g. /fng/) so developers and analysts can fetch historical or live values.
How the Index Is Constructed — Data, Weighting & Methodology
To use it wisely, you must understand how it’s built and what goes into it. Here are its core components:
| Component | Weight | What It Measures | Rationale |
|---|---|---|---|
| Volatility | 25% | Current volatility and maximum drawdowns compared to 30- and 90-day baselines | Large volatility spikes can signal fear or panic |
| Market Momentum / Volume | 25% | Buy/sell volumes, momentum metrics vs historical averages | Sudden surges imply herd behavior |
| Social Media | 15% | Tweet volumes, hashtag use, interaction on crypto topics | High social buzz implies heightened emotional activity |
| Dominance | 10% | Bitcoin market dominance (%) relative to altcoins | Shifts may reveal risk appetite vs retreat to “safer” BTC |
| Trends (Google Trends) | 10% | Search interest changes for relevant queries | Spikes in fear-oriented search terms may reflect panic |
| Surveys | 15% (currently paused) | Poll sentiment from public crypto investors | Attempts to capture direct sentiment (though often noisier) |
— Note: as of now, the survey component is paused.
Each category is normalized and then aggregated (with equal weighting per category) to produce the final index value (0–100).
Important caveat: Since different components have different noise profiles and lags, the index captures emotion broadly — but not always cleanly or in timely fashion.
Historical Behavior & Empirical Observations
A tool is only useful if it has some empirical backing. While the index is relatively popular, academic or rigorous backtesting is limited (given the short lifespan of crypto markets). Still, here are key observations and use cases drawn from market practitioners.
Case Studies: Sentiment Spikes & Reversals
- In crypto bull runs, peaks in greed often precede local top formations (sharp corrections or consolidations).
- During market crashes, extreme fear readings often coincide with capitulation bottoms (though identifying the exact bottom is still extremely tricky).
- Some traders use divergence: e.g. price makes new high, but fear & greed doesn’t move toward “extreme greed” — that may warn of waning momentum.
Limitations of Empirical Reliability
- Lag & Smoothing: Because several components use multi-day baselines (30–90 day comparisons), the index doesn’t always move in real time.
- False signals: In highly trending markets, greed can persist for long stretches without immediate reversal.
- Survivor bias & regime dependence: Crypto markets evolve, new participants shift behavior, and what “extreme greed” means now might differ from a few years ago.
- Lack of specialization: The index is generalized; it doesn’t differentiate between sectors (DeFi, NFTs, etc.), so you might miss submarket sentiment.
In short: it’s best used as a complementary signal — not a standalone trade trigger.
How Traders Use the Fear & Greed Index: Strategies & Tactics
Here are practical ways to incorporate the index into your trading or investing methodology.
Contrarian Sentiment Strategy
- Buy on Extreme Fear: When the index falls into the “Extreme Fear” zone (say < 20–25), some traders look for oversold setups or reversal patterns.
- Take Partial Profits on Extreme Greed: When sentiment enters the “Extreme Greed” zone (say > 70–80), consider taking profits, tightening stops, or hedging positions.
- Dynamic Position Sizing: Modulate risk allocation based on sentiment. E.g. during fear, deploy more capital; during greed, reduce size or shift to defensive posture.
Divergence Strategy
- Price–Sentiment Divergence: If price is rallying but sentiment fails to reflect increased greed (or falls), that may warn of weakening participation.
- Momentum Confirmation: Use it as a filter — only take long trades when momentum is bullish and sentiment isn’t extreme greed.
Sentiment Overlay in Algorithmic Systems
- Sentiment thresholds as rule triggers: e.g. only open new longs if Fear & Greed < 60; avoid adding to positions if > 80.
- Sentiment smoothing / rolling average: Use moving averages or z-score normalization on the index to reduce noise.
- Backtest with hold periods: For instance, after fear crosses below 25 for three consecutive days, open long and hold until sentiment crosses back above 50.
Complementing with Other Sentiment / Market Indicators
- On-chain metrics (e.g. NVT ratio, HODL waves)
- Funding rates / open interest (for derivatives)
- Volatility indices (e.g. BVOL / Deribit metrics)
- Order book depth / sentiment from derivatives positioning
By using the Fear & Greed Index as one pillar in a multi-indicator framework, you can reduce signal noise and avoid overreliance on one metric.
How to Access, Embed & Automate the Index
API Access
Alternative.me provides a public API for their “Fear & Greed” data. You can query JSON or CSV formats, with adjustable limits and date formatting.
Example (pseudo):
GET https://api.alternative.me/fng/?limit=30
This returns the recent 30 days of index values in JSON form, with fields such as "timestamp", "value", and "value_classification".
You can automate regular fetches and store results locally, or integrate into dashboards (e.g. Python, JavaScript, or in Excel via API calls).
Embedding Widgets
Alternative.me offers embeddable image widgets (auto-updating PNG) or fixed-date images to place in blogs or dashboards.
You just need to embed:
<img src="https://alternative.me/crypto/fear-and-greed-index.png" alt="Crypto Fear & Greed Index" />
Or use their embed links for fixed snapshots.
If your site supports dynamic scripting, you could overlay interactive charts (line graphs, heat maps) using your own frontend tools (D3.js, Chart.js) fed by the API.
Creating Your Own Custom Index
Given certain limitations of the public index (e.g. fixed weights, paused survey), serious users sometimes build custom sentiment indices:
- Use alternate social sources (Reddit sentiment, Telegram, Discord)
- Use alternate weightings or adaptive weights based on volatility regime
- Filter out bots/spam or normalize by volume
- Use machine learning models to weight inputs dynamically
This gives you more flexibility, and potentially better responsiveness than a “one-size-fits-all” index.
Limitations & Best Practices (What It Won’t Tell You)
While powerful, the Fear & Greed Index should be used cautiously. Here are pitfalls and how to mitigate them:
- Correlation vs Causation — Just because sentiment is extreme doesn’t guarantee reversal.
- Lag Effects — Sudden sentiment changes may arrive after a move has already occurred.
- Market Regimes Change — What was “extreme greed” in 2017 might not hold in 2025.
- Overfitting Danger — Backtests based solely on sentiment often overfit scarce data.
- Blind Spots in Submarkets — It’s BTC-centric; sentiment around DeFi, altcoins, NFTs may deviate.
- Noise in Social/Trend Signals — Social media or Google Trends spikes can be manipulated, noisy, or distort sentiment.
- Survey Suspension — Since the survey part is currently paused, one element is missing.
Best Practices
- Always confirm with price action or momentum indicators
- Use the index as a signal filter, not primary trigger
- Smooth or average the index to reduce whipsaws
- Adapt thresholds dynamically (e.g. “extreme greed” might shift depending on volatility)
- Combine with robust risk management (stop losses, position sizing)
Example Workflow: Sample Strategy Using Fear & Greed
Here’s a simple illustrative workflow you could test or paper trade:
- Fetch the daily Crypto Fear & Greed Index via API.
- Compute a 3-day moving average of the index to smooth.
- Define zones:
- Fear zone: < 25
- Greed zone: > 75
- Long Entry: If the smoothed index crosses from below 25 upward AND price breaks above a short-term resistance (e.g. 20-day high), open a long.
- Exit / Partial Exit: Close or reduce when the smoothed index rises above 60 OR when price shows reversal signals.
- Avoid New Longs when index > 75; possibly shift to hedges or short (if your system supports)
- Use stop-loss relative to volatility (e.g. ATR)
- Backtest over historical periods (bull / bear / sideways) and refine thresholds.
This is only a template — the optimal thresholds, hold times, smoothing windows, and filters depend on your strategy, timeframe, and risk tolerance.
FAQ & Myths
Q: Is the Fear & Greed Index always right?
A: No. It’s a sentiment gauge, not a precise forecasting tool. It gives context, not certainty.
Q: Can you trade directly on the index?
A: Not directly — but you can build signals around its levels and integrate those into your setups.
Q: How often should you check it?
A: Daily is sufficient for longer-term trades; for intraday or swing strategies, combining with higher-frequency sentiment data is better.
Q: What’s better — custom sentiment index or the public one?
A: A custom version gives flexibility and potentially more relevance, but it requires more maintenance and validation.
Q: Does it account for altcoin sentiment?
A: Not explicitly — its focus is primarily on Bitcoin, though Bitcoin dominance is an input.
Summary & Next Steps
The Crypto Fear & Greed Index is a powerful sentiment tool when used wisely and as part of a broader toolkit. Its ease of use and wide adoption make it a staple among traders, but its limitations and noise also mean you should not treat it as gospel.
To make it actionable:
- Automate data retrieval with the API
- Backtest your own strategies using it as a filter or contrarian signal
- Build or augment with additional sentiment metrics
- Always include price validation, risk controls, and diversification
 XAUT-USD
 AMD
AMD JNJ
JNJ MARA
MARA SHOP
SHOP UNH
UNH BULL
BULL EURUSD=X
 CL=F
CL=F