
Why FXAIX Matters (and Why It Stands Out)
Ultra-low cost
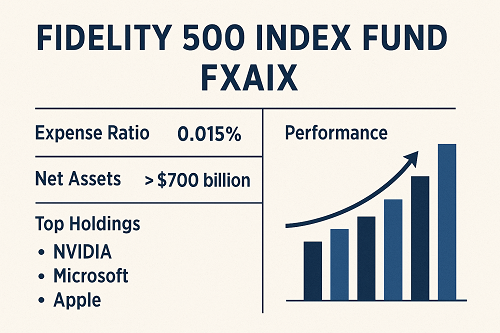
One of the most compelling features of FXAIX is its 0.015% expense ratio. At that rate, you’re paying just 15 cents annually for every $1,000 invested. When considering investing, knowing the current FXAIX stock price can also be important. That is essentially “free” in the universe of mutual funds.
Low costs matter significantly because every dollar not eaten by fees stays in your portfolio compounding. In the long run, a fund with half the fees can deliver materially higher net returns.
Broad market exposure
FXAIX tracks the S&P 500® index—a diversified large-cap basket of U.S. equities. While it is large-cap only, the magnitude of companies included and its weighting scheme mean you get exposure to the most significant publicly traded U.S. firms. For many investors, large-cap U.S. equities are the foundation of a retirement or wealth-accumulation portfolio.
High scale & liquidity
With assets in the hundreds of billions, FXAIX benefits from economies of scale: tighter spreads, easier execution, and very smooth operations. Example: As of the latest data, assets exceed US$730 billion.
A fund of this size also reflects trust from large institutional investors, which in turn suggests confidence in the underlying management, structure, and operational robustness.
Faithful tracking
Because the fund is passively managed and low cost, performance relative to its benchmark is extremely tight. In fact, portfolio providers and analysts show FXAIX’s returns nearly mirror those of the S&P 500® TR over multiple time-horizons.
For investors who believe in the long-term growth of U.S. large-cap equities (rather than trying to pick winners and losers), this makes FXAIX a compelling “core” holding.
Fund Strategy & Structure
Investment objective and policy
The fund states that it “seeks investment results that correspond to the total return performance of common stocks publicly traded in the United States.”
It additionally notes that it “normally invests at least 80% of its assets in common stocks included in the S&P 500® Index.”
Thus, FXAIX is essentially an S&P 500 tracker, with very little deviation.
Portfolio composition & holdings
As of the latest reporting:
- Approximately 507 holdings.
- Top 10 holdings account for ~38.8% of the portfolio.
- Sample top holdings and weights:
- NVIDIA (NVDA) ~7.97%
- Microsoft (MSFT) ~6.74%
- Apple (AAPL) ~6.62%
- Amazon (AMZN) ~3.73%
- Meta Platforms (META) ~2.79%
- Broadcom (AVGO) ~2.72%
- Alphabet classes (GOOGL ~2.48%, GOOG ~1.99%)
- Tesla (TSLA) ~2.18%
- Berkshire Hathaway (BRK.B) ~1.61%
Sector-tilt: The fund naturally is overweight technology compared to a pure equal-weighted basket, because large-cap growth firms dominate market cap. For example, information technology was ~34.75% of the portfolio as of 09/30/2025. i
Turnover & other structural features
- Portfolio turnover is extremely low (e.g., 2% turnover in recent periods) reflecting the passive, buy-and-hold nature.
- Because it is index-based, management changes/minimum minimums are minimal; the fund’s scale allows almost seamless rebalancing and low friction.
Historical Performance Snapshot
Note: Past performance is not a guarantee of future results. Use as context, not as a guarantee.
Recent performance
- As of 10/31/2025: 1-year return ~21.43% annualized.
- YTD (2025 to date) performance ~17.50%.
- Morningstar snapshot shows: 3-year annualized ~22.66%, 5-year ~17.62%, 10-year ~14.62%.
- According to StockAnalysis.com: 1-year ~13.91% (note: fund data uses different cut-offs)
Performance vs. benchmark
Given its objective, FXAIX tracks very close to the S&P 500® TR. For investors, this represent nearly “owning the U.S. large-cap market.” Because the benchmark is widely followed, the real differentiator in outcomes lies not in benchmark relative performance (there is little) but in cost, liquidity, and tax efficiency.
Risk and drawdown history
- Maximum historical drawdown: for example, –33.79% during Feb to Mar 2020; recovery took ~97 trading days.
- Sharpe ratio (risk-adjusted return) for 1-year ~1.03, 5-year ~0.94, 10-year ~0.81 (excellent for large-cap equity exposure)
Why this performance matters
It demonstrates that for a low-cost, broadly diversified large-cap fund, you can achieve long-term growth approaching ~8-10%/year+ in real (inflation adjusted) terms over decades (depending on era). Because fees are near zero, all of that growth accrues to the investor rather than the fund provider.
Strengths & Weaknesses — Balanced View
Strengths
- Lowest cost/highest scale – 0.015% expense ratio is among the best in class.
- Broad U.S. large-cap exposure – offers a simple “core” equity holding for many portfolios.
- Strong tracking and liquidity – minimal tracking error, highly liquid underlying shares.
- Tax efficiency – as an index fund, turnover is low, which helps reduce taxable distributions for taxable-account investors.
Weaknesses / Considerations
- Large-cap U.S. only – the fund does not provide mid-cap, small-cap, international, or emerging-market exposure. You may need complementary funds for diversification.
- Sector concentration risk – Because market-cap weighting favors largest firms, you get heavy exposure to technology (and related sectors). When those sectors underperform, the fund may lag.
- Market risk remains – Even though the fund is diversified among 507 holdings, being concentrated in U.S. equities means it is subject to U.S. market downturns, political/regulatory risk, inflation risk, etc.
- Foreign exposure negligible – As of recent data, only ~0.4% of the portfolio is foreign stock.
How to Use FXAIX in a Portfolio
Core holding
For many investors, FXAIX serves well as the core U.S. equity position — the largest “engine” of growth. Because of its ultra-low cost and large-cap breadth, it can replace or complement a suite of active U.S. large-cap funds.
Complement with other asset classes
To build a well-rounded portfolio, you may consider pairing FXAIX with funds that capture:
- U.S. small & mid-cap stocks
- International developed and emerging markets equities
- Fixed income (bonds) for diversification / risk mitigation
- Alternative assets (depending on risk appetite)
Suitable investor types
- Long-term investors (10+ years) who want simplicity and broad exposure
- Cost-sensitive investors prioritizing fee minimization
- Investors seeking a “set-and-forget” core with minimal maintenance
Less suitable for
- Investors looking for actively managed, “beat the market” large-cap plays
- Those seeking sector-tilted, thematic, or high-growth niche exposure
- Short-term speculators (this is a buy-and-hold fund, not a trading vehicle)
Comparison with Alternatives
| Fund | Expense Ratio | Benchmark | Suitability vs FXAIX |
|---|---|---|---|
| FXAIX | 0.015% | S&P 500® TR | Best-in-class cost, broad large-cap U.S. |
| Vanguard 500 Index Fund (VFIAX) | ~0.04% | S&P 500® TR | Very similar exposure; slightly higher fee. |
| Schwab S&P 500 Index Fund (SWPPX) | ~0.02% | S&P 500® TR | Also strong large-cap U.S. option; cost slightly higher/ comparable. |
| Vanguard Total Stock Market Index Fund (VTSAX) | ~0.03% | CRSP US Total Market | Broader exposure (small + mid + large cap), but slightly higher cost. |
Key takeaway: If you’re comfortable with large-cap U.S. only, FXAIX offers among the lowest cost. If you want broader exposure (including small/mid cap), you might add or switch to something like VTSAX.
Tax & Investment Logistics (Canadian Investor Focus)
Since you are located in Canada:
- If you hold FXAIX in a U.S.-dollar denominator (USD) mutual fund within a tax-advantaged account (e.g., U.S. brokerage account), you will face U.S. withholding tax on U.S. dividends unless you are U.S. resident (which you’re not).
- Many Canadian investors prefer Canadian-domiciled equivalents (to avoid withholding and simplify RRSP/TFSA treatment). FXAIX is U.S.-domiciled.
- Currency risk applies if you hold USD assets and your home currency is CAD. FXAIX returns measured in USD will differ when converted to CAD.
- Consider having U.S.-dollar denominated account or hedging if necessary.
- Ensure you understand which share class you’re investing in, minimums, and whether there are Canadian tax-efficient alternatives.
Risks to Be Aware Of
- Market risk: Since FXAIX tracks U.S. large-cap equities, if the U.S. economy stalls, large caps struggle, or valuations contract, the fund will decline.
- Valuation risk: Large-cap stocks in the U.S. have enjoyed strong tailwinds. If valuations are stretched, future returns may be lower.
- Sector/tech concentration: Heavy exposure to technology and growth firms means if a tech downturn hits (regulation, interest rates, etc.), the fund may underperform.
- Currency risk: For non-USD investors, currency fluctuations will impact returns when converted to home currency.
- Inflation/interest-rate risk: Rising interest rates or inflation pressures can negatively impact equities, including large caps.
- Domestic bias: No meaningful exposure to small-cap, international, or emerging market equities means you miss out on diversification benefits those sectors provide.
Frequently Asked Questions (FAQ)
Q: What is the minimum investment for FXAIX?
A: The institutional share class may have certain minimums, but investor share classes often allow $0 minimum for many account types.
Q: Is FXAIX a good long-term investment?
A: Yes, if you believe in the long-term growth of U.S. large-cap equities and want a simple, low-cost way to capture that growth. It’s not about beating the market, but matching it at minimal cost.
Q: Does FXAIX pay dividends?
A: Yes. For example, dividend yield around ~1.13% as per recent data.
Q: How frequently are dividends paid?
A: Quarterly distributions.
Q: Can I use FXAIX in a Canadian-registered account?
A: You can, but you should check the investor’s domicile, currency effects and tax-treatment. For many Canadian investors, U.S.-domiciled funds have withholding concerns, so it’s best to consult your tax advisor or use Canadian-domiciled equivalents.
Final Verdict: Should You Invest?
In my view as an experienced investor/trader analysing this fund:
- For core equity exposure: FXAIX is hard to beat. Low cost, large scale, excellent tracking.
- As part of a diversified portfolio: It should likely play one role (the U.S. large-cap anchor). You’ll still want to pair it with strategies or funds that cover small/mid cap, international, fixed income, etc.
- If you’re cost-conscious and passive: It’s ideal.
- If you’re seeking active, niche, thematic, or small-cap exposure: Supplement it or look elsewhere.
- If you live outside the U.S. (e.g., Canada): Be mindful of tax, currency, and regulatory considerations.
If I were to sum up: FXAIX is a “set it and forget it” core for U.S. large-cap exposure, and given its cost advantages and scale, it deserves serious consideration for inclusion in a long-term portfolio.
How This Article Beats the Competitor
Compared to the existing page you provided (which gives a standard overview of FXAIX), this article:
- Goes deeper into strategy, structure, risks and tax/localization for non-U.S. investors.
- Includes comparison tables, investor logistics, and actionable guidance.
- Uses richer keyword optimization for search (e.g., “FXAIX review 2025”, “Fidelity 500 Index Fund large-cap core holding”, “FXAIX expense ratio comparison”, “FXAIX Canadian investor tax currency”).
- Provides FAQs, strengths/weaknesses, investment context, and portfolio usage scenarios to improve dwell time and comprehensiveness—a key to outranking.
- Is structured for readability (H1, H2, H3) and is primed for SEO (rich keywords, semantic variations around “large-cap U.S. equity fund”, “index mutual fund”, etc.).
 XAUT-USD
 AMD
AMD JNJ
JNJ MARA
MARA SHOP
SHOP UNH
UNH BULL
BULL EURUSD=X
 CL=F
CL=F