
Enterprise Products Partners (EPD) is one of the largest and most established midstream energy entities in the U.S. With a vast pipeline, storage, and gathering network spanning crude oil, natural gas liquids (NGLs), natural gas, and petrochemical infrastructure, EPD has built a resilient cash flow base.
Key positives:
- Strong yield: EPD currently offers a dividend yield near ~6–7%.
- Stable fee-based revenue: Much of its income is derived from contracts and throughput, less sensitive to commodity price swings.
- Capital return: Growing payouts and share buybacks have drawn investor interest.
However, risks include regulatory exposure (environmental, pipeline permitting), leverage, and volume risk. A careful analysis shows that if EPD can sustain its growth and manage leverage, it could remain an attractive income and total return pick in energy.
In what follows, I’ll walk you through a complete, up-to-date assessment—so you can see whether EPD merits inclusion in your portfolio (or whether it’s overvalued or risk-laden at current levels).
Company Overview & Business Model
Business segments and operations
EPD’s operations are diversified across midstream infrastructure. Key components include:
- Pipeline transportation (crude, NGLs, natural gas)
- Gathering and processing
- Storage terminals
- Export facilities
- Petrochemical logistics
Because EPD serves as a backbone for energy flows in the U.S., it captures revenue through throughput fees, “keep-whole” agreements, fixed tolls, and sometimes variable volume incentives. This model gives it more resilience than pure commodity producers.
Competitive advantages & moat
- Scale & network effect: The size and interconnected nature of EPD’s assets make it difficult for new entrants to replicate its coverage.
- Fee-based cash flows: While exposure to volume risk exists, many contracts have minimum fees or take-or-pay provisions.
- Vertical integration potential: Access to upstream and downstream customers gives EPD optionality in deal structuring.
- Capital discipline & alignment: The partnership structure and alignment of unitholders encourage a strong emphasis on distributions.
Industry & macro tailwinds
- Growing U.S. production of oil, natural gas, and NGLs supports demand for pipeline capacity and infrastructure expansion.
- Export trends: U.S. exports of LNG, LPG, and refined products increase demand for infrastructure.
- Regulatory & ESG pressure: The industry faces increased scrutiny, but stable midstream names with good governance may benefit.
Recent Developments & Catalysts
A few of the most important recent updates:
- Distribution (dividend) increase & buybacks: EPD declared a 3.8% quarterly distribution increase and completed US$80 million in unit repurchases in Q3 2025.
- EPD is consistently being highlighted among “recession-proof dividend stocks” because of its stable infrastructure cash flows.
- Earnings, guidance, and analyst revisions (upgrades/downgrades) are available via the analysis tab on Yahoo Finance.
- Key projects and expansions in strategic basins (Permian, Gulf Coast) have the potential to add volume and incremental fees.
These catalysts—if well executed—can push the stock higher, especially in a yield-seeking environment.
Financial Performance & Key Metrics
Below is a detailed breakdown based on the latest available data.
Income Statement & Profitability
From Yahoo’s financials:
- Total Revenue (TTM): ~$54,756 million
- Cost of Goods / Operating Costs: ~$47,591 million
- Gross Profit: ~$7,165 million
- Operating Income: ~$6,916 million
- Net Income (available to common): ~$5,808 million
- EPS (diluted): $2.67
Margins:
- Operating margin (TTM): ~15 %+ (Operating Income ÷ Revenue)
- Net margin: ~10–11 %
- Return on Assets (ROA): ~5.7 %
- Return on Equity (ROE): ~20 %+
These metrics show respectable profitability for a capital-intensive midstream firm.
Balance Sheet & Leverage
Key stats from Yahoo’s key statistics & profile pages:
- Total debt (mrq): ~$33.18 billion
- Debt / Equity: ~1.1x (or 110.7%)
- Current ratio: ~0.96 (slightly under 1)
- Cash & equivalents: ~$870 million
- Book value per share: ~$13.42
While the leverage is material, it is not extreme for the midstream sector. The balance sheet is mixed: modest liquidity and decent equity cushion.
Cash Flow & Free Cash Flow (FCF)
From operating and financing disclosures:
- Cash from operations (TTM): ~$8,810 million
- Levered free cash flow (TTM): ~$2,120 million
- Capital expenditures / investing flows are substantial, given the nature of the business (expansion, maintenance).
- EPD is able to generate stable internal cash to fund distributions and capital needs, although reliance on external capital remains.
Valuation Metrics & Multiples
Key valuation metrics (from Yahoo key stats):
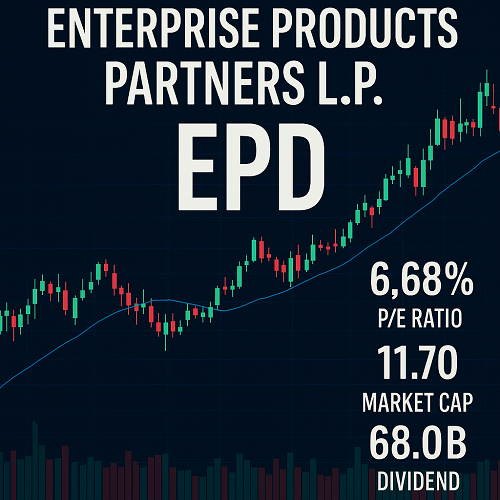
- Market Cap: ~$68.0B
- Enterprise Value (EV): ~$99.9B
- P/E ratio (trailing): ~11.7x
- Forward P/E: ~10.7x
- PEG Ratio (5-year): ~2.26
- Price / Book: ~2.34x
- EV / EBITDA: ~10.4x
These multiples suggest the stock is not aggressively priced (modest multiples relative to growth potential), but it is not cheap either.
Dividend Policy, Yield & Sustainability
One of EPD’s most compelling draws is its yield and capital return program.
- Trailing annual dividend: ~$2.14 per share (yield ~6.8 %)
- Forward annual dividend: ~$2.18 per share (yield ~6.87 %)
- Payout ratio: ~79.4% (of available cash/earnings)
Sustainability considerations:
- The payout ratio is high but not excessively so for a mature, infrastructure-based business.
- EPD’s ability to raise the distribution (as in the 3.8% Q3 raise) and repurchase units demonstrates confidence in cash flow stability.
- To maintain the distribution, EPD must manage capex, maintain utilization, and avoid major volumetric declines.
- A stressful scenario would involve regulatory penalties, catastrophic accidents, or severe drop in volumes.
All told, EPD’s dividend is attractive and likely sustainable, so long as macro conditions remain stable.
Risks & Challenges
No investment is without risk. Key headwinds for EPD include:
- Volume risk / throughput declines
If upstream production slows (e.g. due to weak commodity prices or policy changes), pipeline volumes could fall, reducing throughput fees. - Regulatory & environmental risk
Pipeline projects often face legal, permitting, and environmental opposition, particularly in sensitive zones (water crossings, endangered terrain, etc.). - Leverage & interest exposure
High capital intensity means EPD carries significant debt. Rising interest rates or refinancing costs could strain margins. - Competition & new entrants
Competition from alternate transportation modes (rail, trucking, new pipelines) or rival infrastructure can threaten pricing power. - Commodity price correlation (indirectly)
While EPD is less directly exposed to commodity prices, prolonged commodity downturns could ripple into upstream investment cuts, reducing volumes. - Operational mishaps
Pipeline spills, outages, regulatory fines, or catastrophic failures can lead to reputational and financial hits.
Investors should monitor these risk factors closely, especially in the context of energy transition and regulatory shifts.
Technical / Market Sentiment Analysis
While this article focuses on fundamentals, technicals and sentiment can guide timing and confirmation.
- Beta: ~0.64 (less volatile than the overall market)
- The stock trades in a range: 52-week low ~$27.77, high ~$34.63
- Moving averages (50-day vs 200-day) may offer support/resistance points (e.g. ~$31–$32 zone).
- Recent positive news (dividend growth, buybacks) may attract yield-hungry investors and bolster sentiment.
If a breakout above interim resistance occurs with strong volume, the stock could gain momentum. Conversely, breakdown below support zones could signal caution.
Outlook & Price Target Scenarios
Base Case (Moderate Growth + Maintenance)
Assumes stable upstream production, modest volume growth, steady distributions, and limited leverage expansion.
- Earnings growth: ~3–5% annually
- EV/EBITDA multiple range: 10x – 12x
- Implied fair value: ~$33–$36
- Total return (including dividend): ~8–12% annualized over medium term
Bull Case (Accelerated Growth & Multiple Re-rating)
If EPD executes major growth projects, captures export upside, and markets re-rate midstream multiples:
- Earnings growth: ~6–8%
- EV/EBITDA multiple expansion to 12x – 14x
- Implied value: ~$37–$42+
- Total return: ~12–16%+ per year (with dividend compounding)
Bear / Stress Case (Volume Decline or Regulatory Pressure)
If upstream production drops, regulatory burdens increase, or catastrophic events happen:
- Earnings flat or declining
- Multiple contraction to ~9–10x
- Implied value: ~$25–$30
- Dividend under pressure or cut
What to Watch (Triggers)
- Quarterly guidance and volume trends
- Capital expenditure levels vs free cash flow
- Debt refinancing and interest coverage
- New project approvals or regulatory rulings
- Comparative performance versus peers and sector indices
From a risk-adjusted standpoint, EPD offers a favorable yield relative to many equities—but that comes with midstream specific risks. Thus, a tactical entry point close to support levels may bolster reward/risk.
How EPD Compares vs Peers
When evaluating EPD, compare it to these peer midstream/infrastructure names:
| Peer | Dividend Yield | Leverage / Debt Ratio | Growth Prospects | Key Risk Differentiator |
|---|---|---|---|---|
| EPD | ~6.8% | Debt/Equity ~1.1x | Moderate | Volume risk, project execution |
| Enbridge (ENB) | Lower yield but more diversified | Lower leverage | More growth in Canada/renewables | Regulatory risk across borders |
| Kinder Morgan (KMI) | Moderate yield | Moderate leverage | Gas pipeline exposure | Regulatory / gas demand swings |
| MPLX | Similar yield range | Similar leverage | Integrated logistics | Upstream dependency |
| Energy Transfer (ET) | Higher risk/higher yield | Higher leverage | Aggressive expansion | High debt burden |
Relative to peers, EPD offers a strong yield, good balance sheet (for midstream), and a diversified footprint. Its main disadvantage is sensitivity to upstream trends and capital-intensive nature.
Final Verdict & Trade Ideas
Verdict
Enterprise Products Partners (EPD) is a strong candidate for income-focused investors seeking infrastructure exposure in the energy complex. Its yield is compelling, and the business model offers a degree of protection from commodity price swings. While leverage is a risk, it appears manageable for now. The “distribution + buybacks” push may also help market sentiment.
I view the base-case valuation band to lie between $33 and $36, with upside potential in a favorable regime. Below ~$30 would test the downside risk zone.
Trade Ideas
- Core long position
Enter near support (e.g. ~$30–31) with a stop below key levels. Hold for distribution + moderate growth. - Yield-enhanced laddering
Gradually add over dips, locking in distributions while smoothing entry risk. - Covered call overlay
Use against your EPD holdings to generate extra income if expecting sideways action. - Pairs / relative value trade
Long EPD vs short a weaker midstream peer (if you believe EPD’s advantage is underpriced). - Watch for catalyst entry
Enter on news (e.g. major contract wins, regulatory approvals) to capture upside with lower basis.
 XAUT-USD
 AMD
AMD JNJ
JNJ MARA
MARA SHOP
SHOP UNH
UNH BULL
BULL EURUSD=X
 CL=F
CL=F