
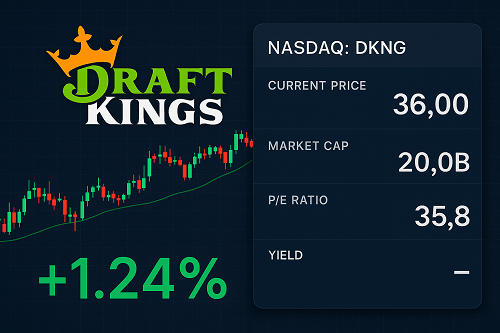
DraftKings Inc. (NASDAQ: DKNG) stands at the intersection of sports, technology, and digital wagering. Once a daily fantasy sports pioneer, it has transformed into a full-scale online betting and gaming powerhouse operating across most legal U.S. jurisdictions. For investors, keeping an eye on the DraftKings stock price is crucial as the company continues to evolve.
The company’s growth story is undeniable — revenue up nearly 50% year-over-year, a rapidly expanding addressable market, and increasing efficiency through technology integration. Yet, profitability remains the missing link.
Investment View (as of October 2025):
- Current price: ~$36
- 12-month fair-value range: $38 – $45
- Analyst consensus: Moderately Bullish
- Investment rating: ⚖️ Hold → Buy on pullbacks below $34
Thesis: DraftKings remains a high-growth platform with durable brand power and significant regulatory tailwinds. However, sustained margin improvement and disciplined marketing spend are essential before the company can justify a long-term premium valuation.
Company Overview & Business Model
DraftKings operates a vertically integrated technology stack across three main revenue streams:
| Segment | Description | 2024 Revenue Share | Margin Trend |
|---|---|---|---|
| Online Sports Betting (OSB) | Core segment offering pre-match, live, and parlay betting on sports | ~55% | Expanding as promo costs fall |
| iGaming (Online Casino) | Slots, blackjack, and table games in regulated states | ~25% | Higher gross margins |
| Daily Fantasy Sports (DFS) | Original user-acquisition engine, strong engagement tool | ~15–20% | Stable |
| Media & Tech Licensing | Advertising partnerships, NFTs, and white-label services | <5% | Early-stage growth |
Strategic Advantage
- Single integrated wallet: Users can seamlessly move funds between DFS, OSB, and iGaming.
- In-house tech (via SBTech acquisition): Enables real-time pricing, lower third-party fees, and product differentiation.
- Data-driven engagement: Personalized odds, loyalty systems, and targeted CRM yield stronger retention and lower CAC.
Geographic Footprint (2025)
- Sports betting active in 27 U.S. states plus Ontario, Canada.
- iGaming active in 7 states.
- International expansion: Early testing in the UK and Latin America through partnerships.
Market Opportunity & Industry Landscape
TAM Expansion
According to Eilers & Krejcik Gaming, the total U.S. OSB and iGaming market could reach $40 billion in annual operator revenue by 2030, roughly double current levels.
Key Catalysts
- New State Legalizations: Large untapped states (California, Texas, Georgia, Florida) represent >30% of U.S. adult population.
- Cross-Sell Ecosystem: DFS and streaming-integrated sports content convert efficiently into bettors.
- In-Game Betting Growth: Live wagering accounts for >50% of handle in mature markets such as Europe.
- Demographic Tailwind: Millennial and Gen Z sports fans show high mobile betting adoption and loyalty.
Competitive Landscape
| Operator | U.S. Market Share (2025E) | Core Strength |
|---|---|---|
| FanDuel | 45% | Flutter Entertainment’s deep capital, strong UX |
| DraftKings | 32% | Proprietary tech stack, aggressive marketing |
| BetMGM | 12% | Casino brand loyalty |
| Caesars / ESPN Bet / Others | <10% | Media reach, niche appeal |
Conclusion: The market is consolidating into a two-player structure, with DraftKings holding defensible share through superior data analytics, promotions, and brand familiarity.
Financial Performance
(Fiscal Year 2024 results with 2025 guidance)
| Metric | FY 2023 | FY 2024 | YoY Change | Management Outlook 2025 |
|---|---|---|---|---|
| Revenue | $3.7 B | $5.5 B | +48% | $6.6 – $6.9 B (+22%) |
| Gross Margin | 41% | 52% | +11 pts | >55% |
| Adjusted EBITDA | ($315 M) | $250 M | Turned positive | $500 M+ target |
| Monthly Unique Players | 3.3 M | 4.6 M | +39% | >5 M |
| ARPU | $114 | $138 | +21% | Stable |
Highlights
- Marketing efficiency improved as promo costs dropped from 32% to 24% of revenue.
- Operating cash flow turned positive in Q2 2025 for the first time in company history.
- Balance sheet strengthened with ~$2.2 B cash and no near-term debt maturities.
Key Concern: Stock-based compensation remains high (> $400 M annually), diluting equity holders.
5. Valuation & Analyst Expectations
At ~$36 per share, DraftKings trades at:
| Metric | Value | Industry Median | Interpretation |
|---|---|---|---|
| Price/Sales (2025E) | 3.1× | 2.4× | Slight premium for growth |
| EV/EBITDA (2025E) | 35× | 28× | Rich vs. peers like FanDuel |
| PEG Ratio | 1.5× | < 1.0× | Moderately expensive |
| Short Interest | 6% of float | — | Neutral sentiment |
Wall Street Consensus (Oct 2025)
- 23 analysts: 16 Buy / 6 Hold / 1 Sell
- Median Target: $42
- High: $55 | Low: $28
Fair-Value Estimate (DCF, base case): ~$41/share (12% upside).
Catalysts & Growth Drivers
- Regulatory Expansion – Every new state adds $200–$500 M potential annual handle.
- iGaming Penetration – Margins >65%; expansion to 10+ states could double profits.
- Operational Leverage – Fixed tech infrastructure enables >60% flow-through on new markets.
- Partnerships – Ongoing collaborations with NFL, UFC, Disney/ESPN drive media-embedded wagering.
- Product Innovation – Parlay builders, micro-bets, and in-app streaming increase engagement and dwell time.
- International Markets – Gradual entry into regulated European and LATAM markets via joint ventures.
Key Risks & Headwinds
| Category | Description | Impact |
|---|---|---|
| Regulatory | Legal uncertainty in large states (e.g., Florida court battles) | High |
| Profitability | Heavy marketing spend could re-accelerate under new entrants | Medium |
| Competition | FanDuel’s scale advantage may erode share | Medium |
| Consumer Behavior | Seasonality & economic softness could lower discretionary spend | Medium |
| Cybersecurity & Integrity | Dependence on secure data systems | Low–Medium |
Mitigation: Continued tech investment and diversification through iGaming and media.
Technical & Sentiment Analysis
Trend (YTD 2025): DKNG +42%, outperforming the S&P 500 (+12%).
| Indicator | Reading | Interpretation |
|---|---|---|
| 50-Day MA | $34.20 | Support |
| 200-Day MA | $30.80 | Long-term support |
| RSI (14-day) | 58 | Neutral–bullish |
| Short Interest | 6.1% of float | Mild bullish |
| Institutional Ownership | 63% | Stable support |
Technical View: Stock consolidating in $34–$37 range. A breakout above $38 with volume > 8 M shares could target $44. Downside support near $32.
Trader Takeaway: Momentum positive but overbought. Accumulation on dips recommended for mid-term holders.
Investment Scenarios
| Case | Key Assumptions | 12-Month Target | Probability |
|---|---|---|---|
| Bull Case | iGaming expands, EBITDA > $550 M, legalization in TX/CA | $50 + | 30% |
| Base Case | Revenue +22%, EBITDA ~ $500 M | $41–$43 | 50% |
| Bear Case | Rising CAC, market share loss, regulatory delays | $28–$30 | 20% |
Verdict: At $36, risk/reward tilts favorably for investors with a 12- to 24-month horizon assuming regulatory momentum holds.
Frequently Asked Questions (FAQ)
Q1: Is DraftKings profitable yet?
Yes — DraftKings achieved its first positive EBITDA quarter in Q2 2025, though GAAP profitability is expected in 2026.
Q2: What are the biggest risks to DKNG stock?
Regulatory uncertainty, high marketing costs, and competitive pressure from FanDuel are primary risks.
Q3: Does DraftKings pay a dividend?
No. Management prioritizes reinvestment and debt reduction over shareholder distributions.
Q4: What’s the long-term outlook?
With steady market expansion and disciplined cost management, DraftKings could double EBITDA by 2027.
Q5: What is the analyst consensus on DKNG?
Most analysts rate DKNG a Buy with median target ≈ $42 (Oct 2025 consensus).
Conclusion — DraftKings: A Play on the Future of Regulated Betting
DraftKings remains the purest U.S.-listed play on legalized sports betting and online gaming.
Its combination of scale, proprietary technology, and brand trust makes it a structural winner as the industry matures.
However, investors should view DKNG as a growth-at-a-reasonable-risk story, not a value play. The stock’s premium valuation reflects high expectations for margin expansion and sustained legalization momentum.
Bottom Line:
- Short-term: Volatile; buy on dips.
- Medium-term (12–24 months): Attractive risk/reward if profitability continues.
- Long-term: Potential multi-bagger if DraftKings captures global share in regulated markets.

 XAUT-USD
 AMD
AMD JNJ
JNJ MARA
MARA SHOP
SHOP UNH
UNH BULL
BULL EURUSD=X
 CL=F
CL=F