
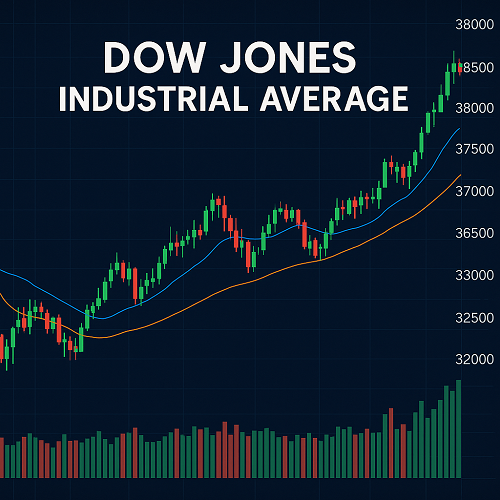
The Dow Jones Industrial Average (DJIA), commonly called “the Dow,” is one of the oldest and most widely-quoted equity indices in the United States and globally.
It tracks 30 large, publicly‐owned “blue-chip” companies that represent a cross-section of U.S. industry and economy.
Its value is calculated based on the share-prices of these companies (rather than their market caps), making it a price-weighted index.
Because of its long history and media prominence, the DJIA is often treated as a barometer of the U.S. stock market and economy.
In short: The DJIA offers a quick “temperature check” of major U.S. equities, but its design and scope mean that it has both advantages and important caveats for serious investors and traders.
History & Evolution of the Dow
Origins
- The DJIA was introduced by Charles Dow and Edward Jones on May 26 1896, initially consisting of 12 industrial companies.
- Over time it expanded and eventually settled at 30 components by 1928, shifting as the economy evolved.
Major milestones
- The index’s constituent list has been revised many times to reflect economic changes (e.g., technology growth, decline of old industry).
- Its methodology also adapted: originally a simple arithmetic average, now uses the “Dow divisor” to adjust for corporate actions (splits, spinoffs).
Why the Dow still matters
- Despite its limitations, the Dow continues to carry weight because of its legacy, media coverage, and the fact that many of its components are major economic bellwethers.
- From a psychological and sentiment-perspective, when you hear “the market is up 300 points,” it’s usually referring to the Dow.
How the DJIA is Calculated & Weighted
Price-weighted methodology
Unlike most modern indices that are market-capitalisation weighted (i.e., larger companies by market cap have greater influence), the DJIA assigns weight based on share‐price.
This means a company with a higher stock price has more impact on the index’s movement than a lower priced stock, regardless of the company’s size.
The Dow divisor
To maintain continuity and account for corporate actions (stock splits, spin-offs), the sum of the component stock prices is divided by a factor known as the Dow divisor.
Example: If you add all 30 component stock prices and then divide by the divisor, you get the DJIA’s value.
Implications
- Because of this structure, a large percentage move in a high-priced constituent can significantly shift the index.
- The methodology makes it less reflective of the total market value of the companies involved. This is one of the core criticisms.
Components: Which Companies Are Included & Why
Selection process
The DJIA’s 30 companies are selected by a committee (appointed by S&P Dow Jones Indices) based on criteria such as: large size, reputation, sustained growth, broad representation of the U.S. economy, and industry leadership.
There are no strict formulaic rules; rather, “guidelines” are used.
Current representation
Although the exact list may change, the 30 companies span key sectors: technology, finance, industrials, consumer goods, healthcare, etc. Note: the DJIA excludes companies from the utilities and transportation sectors, which have separate specialized indices.
Why components change
Changes in the list occur when companies become less representative of the economy, merge, get acquired, or face structural decline.
E.g., new additions reflect the growing importance of technology companies in the U.S. economy.
Strengths, Limitations & Criticisms
Strengths
- Historical depth & recognition: With origins in 1896, the DJIA offers a long data-series for trend analysis.
- Simplicity & media familiarity: Its reporting is straightforward and broadly understood (“Dow points up/down”).
- Major company coverage: While only 30 companies, they are among the most influential in the U.S. economy, which gives it signal value.
Limitations & Criticisms
- Limited sample size: With only 30 stocks, many analysts argue the DJIA is not sufficiently diversified to represent the U.S. equity market.
- Price-weighted bias: Because weighting is based on share price rather than the company’s market cap, companies with high per-share prices can dominate the index’s moves irrespective of their economic size.
- Lack of sector breadth: The DJIA excludes entire sectors (utilities, transportation) by design, which may limit its ability to reflect the full economy.
- Not directly investable: You cannot buy the index itself; you can only invest via tracked products (ETFs, futures) that attempt to replicate its performance.
What this means for users
Investors and traders should treat the DJIA as one of several tools—not the sole benchmark. Its moves may provide signals, but reasoned investment decisions should consider broader indices and fundamentals.
The DJIA in Global Context: Benchmarks and Comparisons
DJIA vs. S&P 500
- The S&P 500 tracks ~500 large U.S. stocks and is market-cap weighted. The DJIA has only 30 stocks and is price-weighted.
- The S&P 500’s broader base gives it greater representativeness of the U.S. market, while the DJIA retains symbolic and historical significance.
DJIA vs. Nasdaq Composite
- The Nasdaq Composite is weighted by market cap and includes thousands of securities. The DJIA is much narrower and older.
- For technology-heavy market views, Nasdaq may offer more relevance; for “blue-chip” signals the DJIA remains relevant.
Global benchmark role
Because the Dow represents major U.S. industry leaders, global markets often reference its movements for cues on sentiment, capital flows, and risk appetite.
How Traders & Investors Use the DJIA
As a macro indicator
Many market participants use the DJIA as a quick gauge of broader market direction—if the Dow is rising, sentiment may be bullish; falling, bearish.
Investment vehicles & exposure
- ETFs: Products like the SPDR Dow Jones Industrial Average ETF Trust (DIA) aim to replicate the performance of the Dow for investors seeking exposure.
- Futures & options: For active traders, Dow futures and options contracts enable speculation on index direction.
Portfolio benchmarking and asset allocation
Institutional investors may compare portfolio performance to the Dow (among other benchmarks) especially when focusing on large-cap U.S. equities.
Traders may also apply the Dow’s apparent movement to gauge risk–on vs. risk–off environments.
Sector/stock timing insights
While the DJIA comprises only 30 stocks, shifts in its composition (or trends in its constituent performance) may hint at changing sector leadership—useful for tactical allocation.
Technical Analysis & Key Patterns for the DJIA
Typical technical analysis considerations
- Trend analysis: identifying long-term support/resistance levels for the index.
- Moving averages: 50-day, 200-day lines to assess bull vs. bear regimes.
- Breakouts/ breakdowns: when the DJIA crosses significant levels, many traders take note.
Trading insights specific to the DJIA
- Because the index is high-visibility and widely-traded via ETFs and futures, its moves often contain a strong component of sentiment and momentum.
- Watch for divergence: e.g., the DJIA rises while breadth (number of advancing stocks) weakens → may hint at internal weakening.
- Use components: monitoring the largest movers within the 30 stocks can provide early signals ahead of the broader index move.
Risk management
- Volatility spikes in the DJIA may signal transitions (e.g., macro shock, earnings surprises).
- Because of its price-weighted nature, one high-priced component moving strongly can skew the index—so traders should check component contributions rather than relying purely on the headline number.
Forecasting and Macro Implications of the DJIA
What a rising or falling DJIA may indicate
- A sustained rise in the Dow often suggests optimism about future earnings, economic growth, and risk appetite.
- A sharp decline can reflect rising concerns: economic slowdown, geopolitical risks, tightening monetary policy, or major corporate stresses.
Leading vs. lagging indicator debate
While the DJIA is often called a “leading economic indicator,” it is important to recognize that it may lag underlying fundamentals—or over-react to sentiment—because of its structure and fewer components.
Nevertheless, many strategists monitor the Dow’s trend in conjunction with other indicators (e.g., yield curves, employment data, sector breadth) to build a fuller market view.
Using the DJIA in macro asset allocation
- Equity exposure: A bullish Dow trend may encourage higher allocation to equities, especially large-cap U.S. stocks.
- Risk mitigation: If the Dow is breaking down, some investors may increase hedging, shift to defensive sectors, or reduce equity exposure.
- Correlations: The DJIA’s behavior can help assess correlations across asset classes (e.g., stocks vs. bonds vs. commodities) and aid in diversification decisions.
FAQs
Q: Can you invest directly in the DJIA?
A: No. The index itself is a statistical measure. You can invest in products (ETFs, futures) that attempt to track its performance.
Q: Why does the Dow include only 30 companies?
A: It was historically set at 30 to provide a manageable and meaningful sample of major U.S. companies. Changing the number would alter its legacy and comparability.
Q: How does the Dow differ from the S&P 500?
A: The S&P 500 includes ~500 stocks and is market-cap weighted; the DJIA includes only 30 and is price‐weighted. This means the S&P 500 generally gives broader market exposure.
Q: Why does a company’s stock price matter more in the Dow than its size?
A: Because of the price-weighted methodology—higher-priced stocks exert more influence, regardless of the company’s total market value.
Q: What are key risks when using the Dow as a benchmark?
A: Limited stock count, price-weighting bias, exclusion of certain sectors, and the fact that it may not reflect smaller‐cap or global companies.
Summary & Key Takeaways
- The DJIA remains a widely‐recognized benchmark of U.S. large-cap stock market sentiment and performance.
- Its price-weighted methodology and limited 30-stock composition are both unique and limiting—users must understand the implications.
- For traders and investors, the Dow can serve as a valuable macro-signal, but should be complemented with broader indices (like the S&P 500), market breadth measures, and fundamental analysis.
- From a technical lens, monitoring the DJIA’s trend, support/resistance zones, and the behavior of its major constituents can assist in timing and risk-management.
- Ultimately, while history gives the Dow prestige, modern portfolio decisions demand awareness of its structural quirks and relative place among many benchmarks.


 XAUT-USD
 AMD
AMD JNJ
JNJ MARA
MARA SHOP
SHOP UNH
UNH BULL
BULL EURUSD=X
 CL=F
CL=F