
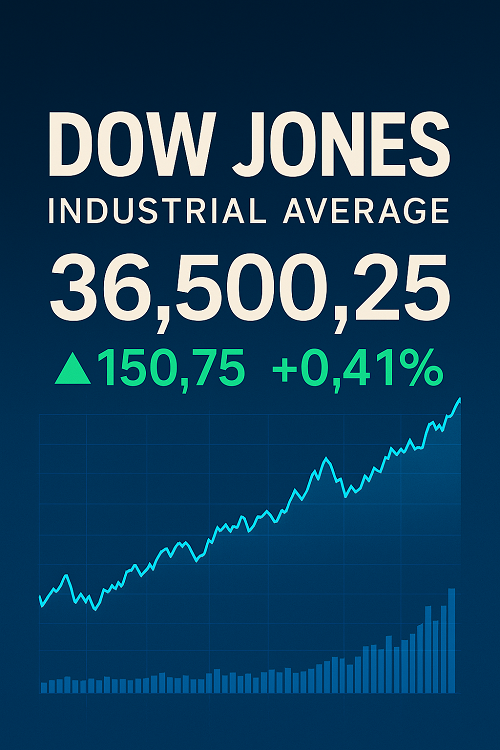
The Dow Jones Industrial Average (DJIA), commonly called the “Dow,” is one of the most recognized equity benchmarks worldwide. Though it dates back over a century, it continues to influence how traders, asset managers, and the public interpret the state of the U.S. stock market.
In this comprehensive guide, you’ll find:
- A detailed breakdown of what the Dow is and how it works
- Methods to read and interpret its real-time movements
- Key drivers that push it up or down
- Trading strategies and tools used by professionals
- Long-term performance context, plus outlook and forecasts
Whether you’re a beginner trying to understand market indices or a seasoned trader looking for deeper insights, this is your one-stop resource for the Dow Jones in 2025 and beyond.
What Is the Dow Jones Industrial Average (DJIA)?
Definition & History
- Origins: Created by Charles Dow and Edward Jones in 1896, initially comprising 12 “industrial” stocks.
- Purpose: To capture the general movement of large U.S. industrial companies.
- Evolution: Over time, the composition expanded (now 30 companies) and has adapted to include a broader representation beyond “industrial” firms.
Construction & Methodology
- Price-weighted index: Unlike most indices (which are weighted by market cap), the Dow gives more weight to higher-priced stocks.
- Dow divisor: To maintain continuity when a component stock splits or gets replaced, a divisor is used to adjust the index’s base.
- Component changes: The index committee can add or remove stocks when needed (e.g. for corporate actions or sector shifts).
Components & Sector Representation
- 30 blue-chip U.S. companies across sectors (industrial, tech, consumer, financial, healthcare, etc.).
- Because the Dow is limited to 30 names, it may underrepresent fast-growing sectors or smaller but dynamic industries.
Differences vs. S&P 500 / Nasdaq
| Feature | Dow Jones | S&P 500 | Nasdaq Composite / 100 / 1000 |
|---|---|---|---|
| Number of constituents | 30 | 500 | Hundreds to thousands |
| Weighting method | Price-weighted | Market-cap weighted | Market-cap or modified |
| Sector balance | Narrower | Broader representation | Technology-heavy |
| Volatility profile | Can be skewed by one high-priced stock | More diversified | Usually more volatile |
Because the Dow is price-weighted, a $1 move in a $400 stock impacts the index as much as a $1 move in a $40 stock — regardless of company size. This quirk can produce divergences from market-cap-weighted indices.
How to Read & Interpret the Dow Jones Today
Price Level, Points vs Percentage Changes
- Absolute level: e.g. “Dow at 36,500”
- Point change: e.g. “Dow up +150 points”
- Percentage change: (point change ÷ prior close) × 100
- Intraday high/low: Useful to see volatility range
Real-Time vs Delayed Quotes
- Financial news sites often show live or near-live quotes (with few-second delay or real-time).
- Exchanges officially publish quotes with minimal delay for subscribers.
Technical Indicators & Overlays
- Moving averages (50, 200 day) to gauge trend
- Bollinger Bands, ATR for volatility bandwidth
- MACD / RSI for momentum
- Support & resistance zones, channels
- Volume and volume profile to detect strength
By layering these indicators on the Dow’s chart, traders spot trend continuation, reversals, or abnormalities.
Drivers & Influences on the Dow Jones
Macro / Economic Data
- Employment (nonfarm payrolls, unemployment rate)
- Inflation indices (CPI, PCE, core vs headline)
- GDP growth or contraction
- Consumer spending data (retail sales, durable goods)
Surprises in these data releases often trigger sharp index moves, as they feed into expectations for corporate profits and monetary policy.
Interest Rates & Central Bank Policy
- Fed rate moves (hikes, cuts) shift discount rates on future earnings
- Forward guidance, quantitative easing/tightening
- Yield curve slope (e.g. inversion) — interpreted as recession signal
Since many Dow components are large enterprises with debt, the interest rate environment directly influences cost of capital and valuations.
Earnings of Component Companies
- When a heavyweight in the Dow (e.g. Apple, Microsoft, Boeing) reports earnings, the index feels the impact.
- Positive surprises can lift the index; disappointments can drag it down.
Because the index is concentrated, a few companies can move the overall index materially.
Geopolitics, Trade, Policy Risk
- Tariff announcements, trade wars, supply chain disruptions
- Fiscal policy changes (tax reform, spending bills)
- Regulatory changes or antitrust actions
Such events can trigger broad market repricing due to changes in risk expectations.
Sentiment & Flow Dynamics
- ETF inflows/outflows (e.g. money moving in/out of $DIA, SPDR Dow ETF)
- Volatility spikes driving flight-to-safety (e.g. into bonds, gold)
- Algorithmic trading, momentum strategies
Short-term index gyrations often owe more to sentiment and positioning than fundamentals.
Dow Jones in Context: Historical Performance & Cycles
Long-Term Returns, Drawdowns, Volatility
- Over decades, the Dow has produced ~7–10% annualized returns (including dividends).
- Major drawdowns (e.g. 2008, 2000–2002 tech bust, 2020 COVID crash).
- Recovery durations (how long it takes to return to prior highs).
Charting cumulative returns over 20- or 30-year periods shows the power of compounding.
Sector Rotation & Its Impact
- During bull markets, cycles often rotate from tech → industrials → consumer → cyclical names.
- Defensive sectors (utilities, consumer staples, healthcare) tend to outperform in downturns.
- Because the Dow has limited representation, it may lag or lead depending on sector trends.
Crisis Periods & Recoveries
- Dot-com crash (2000s): the Dow held up somewhat compared to tech-heavy indices.
- 2008 financial crisis: sharp decline, multi-year recovery.
- COVID-19 crash 2020: rapid drop, historically fast rebound.
Lessons: markets discount forward-looking expectations; liquidity and central bank policy often drive recoveries more than fundamentals.
How Traders Use the Dow Jones
Index Derivatives: Futures, Options, ETFs
- DJIA futures (e.g. E-mini Dow) enable leveraged exposure or hedging
- Dow options allow directional bets, hedging, volatility plays
- ETFs: e.g. DIA (SPDR Dow Jones Industrial Average ETF) gives direct exposure
These instruments enable traders to manage risk, take leveraged directional views, or arbitrage divergences.
Intermarket Strategies
- Dow vs Treasury yields: rising yields can pressure equities
- Dow vs commodities (oil, metals): cyclical shifts
- Dow vs currency pairs (USD strength/weakness)
- Correlation regimes: low vs high correlation periods
Many macro traders monitor these relationships to anticipate sector performance or index momentum.
Momentum & Trend Strategies
- Breakout / breakout pullbacks: Enter when Dow breaks resistance or retests it
- Relative strength screens: Compare Dow performance vs S&P, Nasdaq
- Mean reversion: Overextensions often snap back, especially near major support/resistance
Using the Dow as a broad market “heartbeat,” many strategies layer in stock-level picks or sector overlays.
Risk Management & Position Sizing
- Because derivatives can be leveraged, proper stops and position sizing are crucial
- Use volatility-based sizing (e.g. ATR, VIX)
- Diversify across timeframes (swing, intraday)
- Monitor correlation breakdowns — at times, Dow may diverge from broader indices
Latest Trends & Outlook (2025–2026)
Key Macro Themes to Watch
- Inflation stickiness vs disinflation trends
- Fed policy pivot or tightening extension
- Consumer strength vs signs of capitulation
- Earnings recession risks in cyclical sectors
Probable Scenarios & Key Levels
- Bull scenario: if inflation cools and Fed pivots, Dow could revisit ~40,000+
- Bear scenario: policy missteps or macro shock could force retest of major support zones (e.g. prior lows)
- Key technical zones: prior peaks, 200-day MA, Fibonacci retracements
Sentiment / Positioning Indicators
- Put/call ratios, VIX term structure
- ETF flows into/out of DJIA, large-caps
- Margin debt, insider activity
These help detect extremes and exhaustion zones before reversals.
Risks & Red Flags
- Earnings disappointments among heavyweight constituents
- Geopolitical shock or escalation
- Policy errors / central bank miscommunication
- Liquidity squeeze or credit stress
Staying nimble and aware of “tail risks” is essential.
Tools & Resources
- Charting / data providers: TradingView, Bloomberg, Refinitiv, FactSet
- Realtime market news sources: Bloomberg, Reuters, CNBC, BNN Bloomberg
- Index trackers / ETFs: DIA, QQQ (for Nasdaq comparison), SPY
- Alerts / APIs: Stock APIs (Alpha Vantage, Polygon, etc.), Webhooks, broker alerts
Use a combination: charts + data feed + news + alerts to stay ahead in fast-moving markets.
Conclusion & Key Takeaways
- The Dow Jones remains a symbolic and functional benchmark for U.S. large-cap, blue-chip equities.
- Its price-weighted nature and limited membership mean that it can diverge from broader market trends.
- Traders should layer technical, macro, and sentiment tools to interpret its moves.
- Because heavyweight stocks can swing the index, monitoring individual component earnings is vital.
- In 2025 and beyond, the biggest near-term drivers will be inflation trends, central bank policy, and macro surprises.
FAQ / Quick Q&A
Q: Why does the Dow sometimes diverge from the S&P 500?
A: Because the Dow is price-weighted and limited to 30 stocks, a large move in a high-priced Dow component can skew the index. The S&P is market-cap weighted and has much broader coverage, so its movements often reflect the wider market more accurately.
Q: How often are the Dow components updated?
A: The index committee convenes as needed (not on a strict schedule). Changes arise due to corporate events (mergers, delistings) or when a company no longer represents the “industrial” or growth profile.
Q: Is the Dow a good proxy for U.S. stock performance?
A: It’s useful as a general barometer, but due to its narrow scope and weighting methodology, many analysts prefer the S&P 500 or total market indices for broader coverage.
11. References & Further Reading
(Here you’d list authoritative sources like academic papers, index provider documentation, financial websites, etc.)
SEO & On-Page Optimization Plan
To maximize your chances of ranking above the BNN Bloomberg page, here’s a suggested SEO and content optimization plan:
| SEO Element | Strategy |
|---|---|
| Primary keyword targets | “Dow Jones”, “Dow Jones today”, “Dow Jones index”, “Dow Jones analysis 2025”, “Dow Jones outlook” |
| Secondary / LSI keywords | “DJIA chart”, “Dow Jones components”, “Dow futures”, “Dow technical analysis”, “Dow history” |
| Title tag & meta description | Title: “Dow Jones Industrial Average Today: In-Depth Analysis & 2025 Outlook” Meta: “Explore real-time moves, drivers, historical context, trading strategies, and expert outlook for the Dow Jones in 2025.” |
| URL slug | /dow-jones-today-analysis-outlook (or similar) |
| Header hierarchy (H1, H2, H3…) | Use a clear, logical structure with H1 for the main title, H2 for main sections, H3 for subsections. Use key phrases in headers (but naturally). |
| Internal linking / site structure | Link to related articles: e.g. “S&P 500 analysis”, “how to trade index futures”, “macro outlook” pages. This helps with SEO authority and user dwell time. |
| Rich media | Include interactive charts, embed historical performance graphs, use infographics (e.g. composition of Dow sectors), possibly video embed. Google likes varied media. |
| Data freshness / updates | Keep updating the article frequently (daily or weekly) with latest data points, technical updates, outlook shifts. That makes it evergreen and signals freshness to Google. |
| Schema / structured data | Use financial structured data or “Index” schema if applicable. Use article schema, publish date, update date markup. |
| User engagement elements | Include a table of key levels, actionable insights (“What traders should watch this week”), charts, comparison tables, FAQs to boost dwell and reduce bounce. |
| Backlink & outreach strategy | Once published, promote on financial forums, share with finance/news aggregators, pitch guest posts linking to it, request references from other market commentary sites. |
| Page performance | Ensure fast load times, mobile responsiveness (critical for ranking), optimized images, lazy loading, compressed charts, minimal render-blocking scripts. |
| Content depth & comprehensiveness | This article must be deeper, fresher, and more practically useful than a simple quote + news site. Cover what others don’t (insight, forecasts, trade ideas). |
| User signals & update cadence | Encourage users to revisit (e.g. “updated weekly”), provide dynamic content (charts) so that Google sees the page as active. |
 XAUT-USD
 AMD
AMD JNJ
JNJ MARA
MARA SHOP
SHOP UNH
UNH BULL
BULL EURUSD=X
 CL=F
CL=F