
Why DJIA Charts Matter
The DJIA, or Dow Jones Industrial Average, is one of the most tracked stock indices globally. While it only comprises 30 large-cap U.S. companies, its behavior often reflects broader market sentiment. Traders and institutional participants use DJIA charts to identify macro trends, assess risk appetite, and benchmark performance.
If you can read DJIA charts skillfully, you gain an early edge in understanding market momentum, spotting regime shifts, and aligning trades across equities, futures, and ETFs.
What Is the DJIA (Dow Jones Industrial Average)?
History & Composition
- Established in 1896 by Charles Dow, the DJIA is one of the oldest equity market indices.
- It comprises 30 “blue-chip” U.S. companies (in sectors such as industrials, technology, consumer goods, financials).
- Components are periodically adjusted to reflect shifts in the economy and corporate structure.
- As of the latest update, companies like Apple, Boeing, Amazon, Caterpillar, etc., are part of the 30 constituents.
How the Index Is Weighted
- Uniquely, the DJIA is price-weighted, meaning that the weight of each stock is proportional to its price—not its market capitalization.
- A $1 move in a higher-priced component influences the index more than a $1 move in a lower-priced component.
- To adjust for stock splits or corporate actions, a divisor is used to maintain consistency in the index calculation.
Limitations & Criticisms
- Narrow sample: Only 30 stocks, which might not reflect broader market breadth.
- Price bias: A lower-priced stock could be more influential than a highly capitalized firm with a low share price.
- Sector skew: Some sectors may dominate, reducing diversification.
- For these reasons, many analysts also refer to broader indices like the S&P 500 or total market indices for confirmation.
Where to Find Reliable DJIA Charts & Data
To conduct meaningful chart analysis, you need trustworthy and flexible sources. Some top ones:
- MarketWatch – DJIA Charts & Historical Data: Interactive charts, overlays, downloadable CSV.
- MarketWatch – DJIA Overview Page: For fundamentals, comparisons, and updates.
- Yahoo Finance — ^DJI Chart: Offers multiple timeframes, standard indicators, and user-friendly UI.
- Wall Street Journal — Advanced Charting: More professional-level charting tools.
- Other platforms: TradingView, Bloomberg, FactSet, and brokerage platforms with charting modules.
When choosing a charting platform, ensure it supports:
- Multiple timeframes (intraday, daily, weekly, monthly)
- Overlay/comparison tools
- Exporting historical data
- Custom indicators / scripting (for advanced users)
Anatomy of a Good DJIA Chart
Before diving into indicators, understand the structural elements of a chart.
Timeframes & Scales
- Intraday (5m, 15m, 1h): Useful for short-term traders or event-driven strategies.
- Daily / Weekly: Core for most swing traders and technical analysis.
- Monthly / Multi-year: For macro perspective and regime detection.
Switching between logarithmic (log) and linear scales helps. On long-term charts, log scale better captures percentage-based moves (e.g. a 50% jump vs. a 10-point move).
Volume and Open Interest
- Volume confirms the strength behind price moves—breakouts with high volume are more trustworthy.
- Though DJIA is an index (not a tradable asset), volume on related instruments (e.g., futures, ETFs like DIA) is what you watch.
Comparison Overlays & Benchmarking
- Compare DJIA performance against S&P 500, Nasdaq, or sector-specific indices to detect divergence or relative strength.
- Some charting platforms allow you to overlay or normalize indices for comparison.
Essential Technical Tools & Indicators for DJIA
Below are the key tools to incorporate:
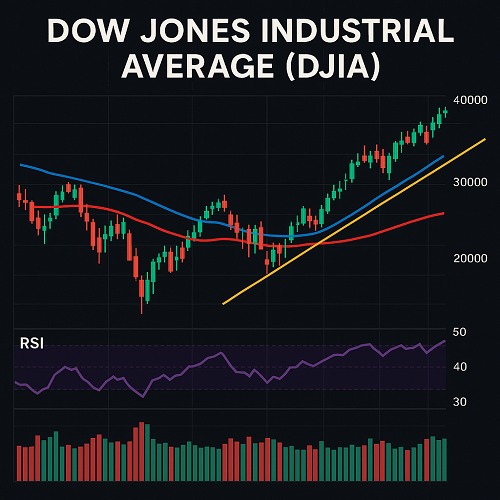
Moving Averages (SMA, EMA)
- Common choices: 20, 50, 100, 200 periods.
- Use crossovers (e.g., 50-day crossing 200-day) to identify trend shifts.
- Dynamic support/resistance: Price reacting off the 200-day MA often signals trend strength or reversal.
RSI, MACD, Stochastic
- RSI (Relative Strength Index): Typically 14-period — signals overbought (above ~70) or oversold (below ~30).
- MACD (Moving Average Convergence Divergence): Useful for trend momentum and signal line crossovers.
- Stochastic Oscillator: Useful to detect short-term extremes and potential reversal zones.
Trendlines, Channels & Price Patterns
- Drawing trendlines across lows (in uptrend) or highs (in downtrend) gives visual structure.
- Channels (parallel lines) can help spot upper/lower boundaries and breakouts.
- Classic chart patterns (triangles, flags, wedges) often precede impulsive moves.
Fibonacci Retracements & Extensions
- Use from swing highs to lows to identify potential support/resistance zones (e.g., 38.2%, 50%, 61.8%).
- For breakout extensions, project to 1.272x or 1.618x extensions.
Support / Resistance Zones
- Use horizontal lines at past swing tops and bottoms.
- Strong zones often represent reaction clusters over time.
- Monitor how price approaches these zones—breakouts, bounces, or false breaks.
Advanced Indicators (Optional but Useful)
- Bollinger Bands: To detect volatility expansions or squeeze setups.
- Ichimoku Cloud: For trend, momentum, and support/resistance in one system.
- ADX (Average Directional Index): To quantify trend strength.
- Volume profile / Market profile: To map where most trading activity occurred.
Interpreting Chart Patterns & Signals
Technical tools are only as useful as your interpretation. Here’s how to think about signals:
Reversals vs. Continuations
- Reversal patterns (head & shoulders, double top/bottom) frequently mark trend exhaustion.
- Continuation patterns (triangles, flags, pennants) indicate pauses before resumption.
Common Patterns
- Head & Shoulders / Inverse
- Double Top / Bottom
- Triangles (ascending, descending, symmetric)
- Flags / Pennants
- Wedges (rising/falling)
Recognize volume behavior: breakouts with high volume validate the move; weak volume often leads to traps.
Breakouts & False Breaks
- A valid breakout should ideally be accompanied by increased volume, retest of the breakout zone, and follow-through.
- Beware false breakouts: price may pierce a zone briefly but revert. Consider waiting for confirmation (e.g., a close beyond, retest success).
Sentiment Confirmation
- Use momentum/volume to confirm price patterns. E.g., when price breaks above resistance but momentum is weakening, caution is warranted.
Multi-Timeframe Analysis Strategy
One of the most powerful ways to trade major indices is via a multi-timeframe (MTF) approach.
Top-Down Workflow
- Macro / Monthly: Identify the prevailing long-term trend and major structural zones.
- Weekly: Detect intermediate trends and validate macro structure.
- Daily: Spot entry triggers, setups, and confirmation.
- Intraday (if trading short-term): Fine-tune entry/exit timing.
The goal is aligning your trades so that the daily timeframe is in agreement with the weekly/monthly trend rather than opposing it.
Market Structure & Macro Interplay
Chart reading is necessary, but context is king. The DJIA is heavily influenced by macro forces.
Role of Macro News & Fed Policy
- Fed interest rate decisions, inflation prints, employment data, and geopolitical events move markets sharply.
- Prior to key news, expect volatility and possible false moves (traps).
Sector Rotation & DJIA Components
- The performance of major constituents (Apple, Boeing, Caterpillar, etc.) can tilt the index significantly.
- Sector rotation (from tech to industrials, or vice versa) can cause divergence between DJIA and other indices like the Nasdaq.
Correlations & Breadth
- Sometimes, DJIA might rally but breadth is weak (few stocks doing the heavy lifting). That’s a signal to be cautious.
- Watch S&P 500, Russell 2000, and NYSE Advancers/Decliners as confirmation.
Risk Management & Position Sizing for Index Trades
Every trader’s success depends as much on preserving capital as on finding setups.
Volatility-Based Sizing
- Use ATR (Average True Range) to gauge volatility.
- A more volatile day → smaller position size; calm day → larger size (within reason).
Drawdown Control
- Define your maximum drawdown threshold per trade (e.g., 1–2% of capital).
- Use stop-losses with enough room for noise but strict enough to protect capital.
Hedging & Diversification
- Consider hedging with inverse ETFs, options, or correlation instruments if exposure is large.
- Allocate capital across different timeframes and instruments (not only DJIA) to reduce concentration risk.
1Sample Trade Ideas & Case Studies
Here are three hypothetical (but realistic) trade setups based on DJIA chart structure:
A. Bullish Breakout Setup
Structure: DJIA consolidates in a symmetrical triangle for several weeks.
Entry: Buy when price breaks and closes above the resistance line with volume.
Confirmation: Retest the breakout zone holds as support.
Target: Use Fibonacci extension (e.g., 1.272x measured move) or next resistance zone.
Stop: Just below the breakout point or retracement threshold.
B. Bearish Reversal Setup
Structure: Price forms a head & shoulders at a long-term resistance zone.
Entry: After neckline is breached.
Confirmation: Volume increases on the downside, retest of the neckline fails.
Target: Distance from neckline to head projected downward.
Stop: Slightly above neckline or below a nearby resistance.
C. Sideways / Range Trading Setup
Structure: DJIA bouncing between clear support and resistance bounds.
Entry: Buy near support, sell near resistance (with confirmation from momentum).
Risk control: Tight stops just beyond the zone.
Note: In compression periods, avoid breakout chasing unless confirmed.
You can backtest these setups on historical DJIA data (via downloadable CSV from MarketWatch) to validate performance.
Common Pitfalls & Mistakes When Trading DJIA
- Overreliance on one indicator — no indicator is infallible.
- Ignoring macro context — price signals may fail if a major news event intervenes.
- Chasing breakouts without confirmation — prone to traps.
- Using inappropriate timeframes — e.g., forcing a daily signal in a strong intraday trend.
- Poor risk management / lack of stop discipline — one big loss can erase many winners.
Advanced Tip: Statistical Indicators & Quant Overlays
For more advanced traders:
- Standard Deviation & Volatility Bands: Help measure normal price dispersion.
- Z-score on price deviations: To determine overextensions.
- Mean Reversion models: Useful in sideways markets.
- Machine Learning / AI overlays: E.g. using regressions, clustering, or Sentiment-LSTM models as a complement (not replacement) to technical analysis.
Frequently Asked Questions
Q1. Is DJIA a good index to trade?
A: It’s commonly traded (via futures, ETFs, derivatives) and offers high liquidity, but its narrow composition and price weighting require supplemental confirmation through broader indices.
Q2. Should I trade DJIA or S&P 500?
A: Many traders prefer S&P 500 for its broader representation and market-cap weighting. But DJIA still provides unique signals, especially when it diverges from S&P 500.
Q3. Is day trading DJIA effective?
A: Yes—but only with good intraday patterns, strong risk control, and awareness of volatility and news.
Q4. How reliable are “death cross” or “golden cross” signals on the Dow?
A: These are lagging indicators. A “death cross” (50-day MA crossing below 200-day) can confirm a downtrend but often after a significant decline has already occurred. MarketWatch Use them in conjunction with leading indicators.
Summary & Key Takeaways
- The DJIA charts are a powerful tool—but must be understood in structure, context, and risk terms.
- Combine technical tools (moving averages, momentum, patterns) with macro awareness and multi-timeframe discipline.
- Always align your trade directions with higher timeframe trends.
- Keep risk management front and center.
- Constantly validate setups via historical data and refine your approach with live practice.
 XAUT-USD
 AMD
AMD JNJ
JNJ MARA
MARA SHOP
SHOP UNH
UNH BULL
BULL EURUSD=X
 CL=F
CL=F