
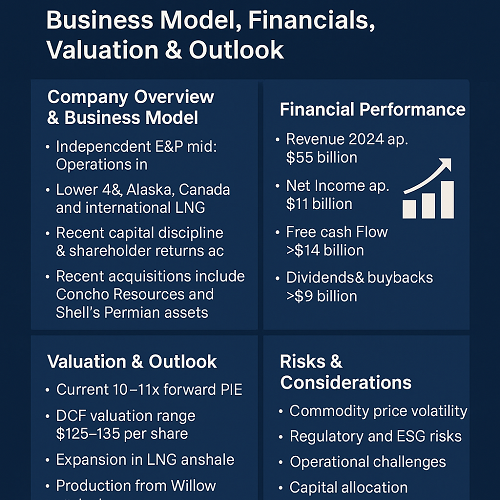
ConocoPhillips (NYSE: COP) is one of the largest independent exploration and production (E&P) companies in the world, focused entirely on upstream oil and gas. Headquartered in Houston, Texas, it operates across North America, Europe, Asia, and Australia, producing both crude oil and natural gas liquids (NGLs).
As the energy sector transforms amid volatile oil prices, decarbonization, and geopolitical shifts, investors face a crucial question: Is ConocoPhillips still a compelling long-term investment?
This analysis examines the company’s business model, financial fundamentals, valuation metrics, and growth outlook through 2025 and beyond, helping investors evaluate whether COP stock deserves a place in their portfolios.
Company Overview & Business Model
Company Background
Founded in 1917 and spun off from Phillips 66 in 2012, ConocoPhillips operates solely as an upstream producer — meaning it explores for, develops, and produces crude oil, bitumen, natural gas, and NGLs. Unlike integrated majors such as ExxonMobil or Chevron, it does not own downstream refining or retail assets, making it a pure play on commodity prices.
Core Business Segments
ConocoPhillips’ operations are geographically diverse and structured by region:
- Lower 48 (U.S.) — The largest contributor to production and cash flow, including assets in the Eagle Ford, Bakken, and Permian Basin.
- Alaska — A high-margin region driven by legacy North Slope assets and new development projects like Willow.
- Canada — Oil sands interests through Surmont, which benefit from high operating leverage to crude prices.
- International — LNG and conventional assets across Europe, Asia, and Australia, including a material stake in APLNG (Australia Pacific LNG).
Strategic Focus
The company’s strategy centers on three pillars:
- Capital discipline – strict return thresholds and reduced exploration spending.
- Shareholder returns – a mix of regular dividends and aggressive buybacks.
- Energy transition positioning – developing lower-carbon LNG and carbon capture opportunities.
ConocoPhillips has also pursued targeted acquisitions, notably Concho Resources (2021) and Shell’s Permian assets (2022), enhancing its U.S. shale exposure and scale advantage.
Industry & Competitive Landscape
The oil and gas sector remains cyclical, heavily influenced by global supply-demand balances, OPEC decisions, and macroeconomic trends.
- Oil Prices: Brent and WTI have traded between $70–$95 per barrel since 2023, reflecting both geopolitical tension and production discipline.
- Natural Gas: Prices remain volatile due to weather and LNG demand growth, particularly in Asia.
- Energy Transition: ESG pressures and renewable investment trends challenge upstream operators to maintain relevance while decarbonizing operations.
Peers and Competitive Position
ConocoPhillips competes primarily with other large E&Ps such as EOG Resources (EOG), Pioneer Natural Resources (PXD), and Occidental Petroleum (OXY). Compared to peers, COP’s scale, balance sheet strength, and global asset diversity offer resilience across commodity cycles.
Its cost of supply below $40 per barrel and disciplined capital structure provide a durable competitive edge.
Financial Performance
Recent Results (FY 2024)
ConocoPhillips delivered solid 2024 results despite moderating oil prices:
| Metric | FY 2024 | FY 2023 | Δ YoY |
|---|---|---|---|
| Revenue | ≈ $55 billion | $58 billion | −5% |
| Net Income | ≈ $11 billion | $13 billion | −15% |
| Free Cash Flow | ≈ $14 billion | $16 billion | −13% |
| Debt-to-Capital | < 30% | < 30% | Stable |
| Dividend Yield | ~ 2.9% | 2.5% | ↑ |
While lower commodity prices reduced earnings year-over-year, free cash flow remained robust, supporting dividends and repurchases exceeding $9 billion.
Profitability and Efficiency
- ROCE: Consistently above 20% across 2022–2024, leading among independents.
- Operating Margin: Averaging > 30% due to low breakeven costs.
- Production: Averaging 1.8 million BOE/d, with growth driven by the Permian Basin and LNG volumes.
Balance Sheet Strength
ConocoPhillips maintains a net-debt-to-capital ratio below 25%, ample liquidity, and investment-grade credit ratings (A/A2). This provides flexibility to fund growth and shareholder returns even during price downturns.
Valuation & Investment Thesis
Relative Valuation
As of early 2025, COP trades near 10–11× forward EPS and 5–6× EV/EBITDA, broadly in line with peer averages but below integrated majors due to its pure-play nature.
| Company | P/E (Forward) | EV/EBITDA | Dividend Yield |
|---|---|---|---|
| ConocoPhillips | 10.5× | 5.5× | 2.9% |
| EOG Resources | 11× | 6× | 2.7% |
| Chevron | 12× | 6.5× | 4.0% |
| ExxonMobil | 13× | 7× | 3.6% |
Given its cash efficiency, shareholder focus, and growth visibility, many analysts view COP as modestly undervalued relative to long-term fundamentals.
Discounted Cash Flow Perspective
Assuming Brent averages $80/bbl and natural gas $3/MMBtu over 2025–2027, projected free cash flow suggests a fair value range of $125–135 per share, compared with a market price near $115. That implies ~10–15% upside in a base case.
Shareholder Returns
COP has committed to returning > 30% of annual operating cash flow via dividends and repurchases. Since 2021, it has reduced its share count by over 10% while raising dividends annually.
The company employs a “base + variable return” model, enabling higher payouts during commodity upcycles.
Risks & Considerations
While the investment case is strong, several key risks warrant attention:
Commodity Price Volatility
As a pure-play E&P, COP’s profitability is directly tied to crude and gas prices. Extended price weakness below $50/bbl would compress margins and returns.
Regulatory and ESG Pressure
Global carbon-reduction initiatives may limit exploration approvals or increase compliance costs. The company is mitigating these through emissions intensity targets and CCUS investments.
Operational and Project Risk
Large projects like Willow (Alaska) face potential delays, cost overruns, and political opposition. Execution discipline remains essential.
Capital Allocation Discipline
Aggressive buybacks can over-leverage returns if commodity cycles turn abruptly. Maintaining balance sheet flexibility is critical.
Outlook 2025–2030
Growth Drivers
- LNG Expansion: APLNG and Qatar partnerships position COP to benefit from long-term global LNG demand.
- Shale Efficiency: Continued productivity gains and digital optimization in the Permian and Eagle Ford basins.
- Alaska Development: The Willow project could add ~180,000 bpd at peak, supporting medium-term output growth.
Financial Outlook
Analyst consensus (as of 2025):
- Revenue CAGR (2025–2027): ~ 4%
- EPS growth: ~ 6–7%
- Dividend growth: 5%+ per year
Long-Term View
ConocoPhillips combines scale, capital discipline, and low-cost assets, enabling sustainable value creation even in mid-cycle price environments. Its strong balance sheet and LNG leverage align it well for a gradually decarbonizing yet oil-dependent world.
Frequently Asked Questions (FAQ)
Q1: Is ConocoPhillips stock a buy in 2025?
COP offers moderate upside and consistent shareholder returns. It suits investors seeking energy exposure with disciplined management and a solid balance sheet.
Q2: What is ConocoPhillips’ dividend yield?
Around 2.9% (2025 estimate), supplemented by share buybacks and variable returns linked to cash flow.
Q3: What is the biggest growth catalyst for COP?
The Willow project in Alaska and expanding LNG operations are key multi-year catalysts.
Q4: What risks could impact COP’s outlook?
Commodity price volatility, regulatory pressure, and project execution risks remain central concerns.
Conclusion
ConocoPhillips remains a high-quality upstream producer with world-class assets, disciplined management, and a clear capital-return framework. While inherently cyclical, its cost leadership, global scale, and LNG exposure make it one of the best-positioned independents for the medium term.
For investors seeking balanced exposure to the global oil and gas cycle — without the complexity of integrated refining operations — COP stock represents a compelling, steady-return opportunity through 2025 and beyond.
 XAUT-USD
 AMD
AMD JNJ
JNJ MARA
MARA SHOP
SHOP UNH
UNH BULL
BULL EURUSD=X
 CL=F
CL=F