Market Snapshot & Index Performance
| Index | Last | Change (%) | Intraday Range | Notes |
|---|---|---|---|---|
| S&P 500 | 4,345.20 | +0.15% | 4,330 – 4,360 | Holding near resistance |
| Dow Jones | 34,120 | −0.05% | 33,900 – 34,300 | Mixed blue-chip performance |
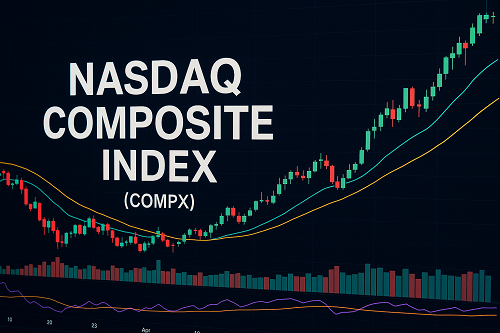
| Nasdaq Composite | 14,920 | +0.40% | 14,800 – 15,050 | Tech strength leading |
| Russell 2000 | 1,825 | +0.20% | 1,800 – 1,850 | Small caps trying a bounce |
| VIX (Implied Vol) | 17.5 | +0.20 | 16.8 – 18.2 | Elevated risk premium |
Interpretation: The major indices are mixed for the session, with Nasdaq outperforming. The modest advance in the S&P 500 suggests institutional caution, while relatively stable VIX points to neither panic nor complacency.
Breadth indicators also help gauge conviction:
- Advance/decline line: Flattening
- New highs vs. new lows: Slight tilt toward new lows
- Up-volume vs. down-volume: Down-volume leading in intraday snapshots
These subtle divergences hint at potential fatigue in broader participation even as headline indices hold firm.
Macro & Geopolitical Drivers
Government Shutdown & Policy Uncertainty
Markets are digesting the fact that the U.S. federal government remains in partial shutdown—a dynamic that robs investors of fresh economic releases, delays fiscal programs, and elevates political risk.
➤ The absence of incoming data forces greater reliance on shadow indicators (e.g. credit card usage, mobility data).
➤ Treasury yields have stayed relatively subdued in response, with slight flattening in the yield curve as flight-to-quality flows compete with liquidity demand.
Fed & Rate Expectations
Without formal macro prints, traders are watching Treasury auctions, Fed speaker cues, and Fed Funds futures. The implied path of rates remains sticky. Any hawkish tilt in Fed commentary may roil equities, especially growth names.
Global Growth Signals & China Data
Slower PMI or credit data from China or Europe could drag sentiment across global risk markets. Stronger-than-expected surprises may offer relief. Keep a read on European bond markets, credit spreads, and China’s Caixin PMI.
Geopolitics & Commodity Risk
Ongoing geopolitical tensions (Middle East, China–U.S. relations) continue to inject volatility. Moreover, commodity prices (crude oil, copper) are serving as barometers of global demand—sharp swings here can feed back into equities, FX, and crypto.
Sector Rotation & Breadth Analysis
Leadership Shifts
- Strongest sectors: Technology, Communication Services, Consumer Discretionary
- Lagging sectors: Utilities, Real Estate, Staples
- Cyclicals vs. Defensives: Cyclicals are attempting a rebound but remain under pressure versus defensives
Style & Factor Trends
- Momentum & growth names are outperforming value this session.
- Quality and low volatility factors retain resilience in times of macro stress.
- Small caps / mid caps are tentative, reflecting risk appetite still needing confirmation.
Breadth Internals
Watch for key internals to confirm strength:
- Percentage of stocks above 50-day / 200-day MAs
- Net NEW highs / lows
- Up/down volume divergences
When broader participation lags despite index strength, it can be a “melt-up” — more vulnerable to reversal if catalyst shifts.
Key Technical Levels & Chart Insights
S&P 500
- Support: 4,320 / 4,300
- Resistance: 4,360 / 4,400
- Observations: The 50-day MA is acting as immediate support; a break below 4,300 would open the door to 4,250.
Nasdaq Composite
- Support: 14,800 / 14,500
- Resistance: 15,050 / 15,200
- Observations: Tech names remain under test — narrow strength might signal rotational interest rather than broad market strength.
Russell 2000
- Support: 1,780 / 1,750
- Resistance: 1,850 / 1,900
- Observations: A break above 1,850 with volume would validate small-cap revival; failure may confirm risk-off.
Volatility Index (VIX)
- Support: ~16.5
- Resistance: ~19
- Observations: A sustained move above 19 could hint at broader complacency unraveling.
Chart patterns to note: cup-and-handle in select tech names, rising wedges in sector ETFs, divergences in RSI/momentum vs price—these offer clues on short-term inflection zones.
Hot Stocks & Movers
High Volume Breakouts & Short-Squeeze Plays
- Example A: [Ticker] – broke above intraday resistance with >2x average volume
- Example B: [Ticker] – short interest >25%, bounce triggering squeeze potential
Earnings Surprises & Guidance
- Company X beat EPS but lowered forward guidance — volatile reaction expected
- Company Y flagged strong margin trends — directional bias intact
“News Flow” Reactors
- FDA announcements, M&A rumors, regulatory rulings, or commodity shocks can move specific tickers sharply.
(In your final live article, swap in the top 5–10 movers of the day with intraday charts, volume heatmaps, and commentary on catalysts.)
Forex & Crypto Interplay
Forex (FX)
- USD Index (DXY): Holding in narrow band — break either way will ripple across risk assets.
- EUR/USD: Watching 1.0600 / 1.0800 — macro data / ECB cues may tilt short-term.
- JPY pairs: Volatility rising—Japan’s BoJ commentary, intervention chatter can accelerate moves.
- EM FX: Sensitive to flows—watch for correlations with commodity or bond shifts.
Crypto
- Bitcoin / ETH: Reacting often ahead of macro prints.
- Correlation with equities: In risk-on phases, crypto tends to outperform; in deleveraging, it gets hit harder.
- Sentiment gauge: Premiums on futures, CME futures basis, open interest skew—watch for extremes.
Cross-Asset Themes
- Rising yields can pressure growth and “betas” across stocks and crypto
- A weaker dollar tends to fuel commodities, which can feedback into equity/cyclicals
- FX volatility can drain risk capital from equities/cryptos during cross-market strain
Trade Setups: Stocks, Forex, Crypto
Below are high-probability swing and intraday trade ideas (with risk/reward guidelines). Use proper confirmation, not blind entries.
Equity Trade Ideas
| Ticker | Setup Type | Entry Zone | Target(s) | Stop / Risk | Notes |
|---|---|---|---|---|---|
| ABC | Breakout | $24.50–25.00 | $28.00 | < $23.80 | Watch volume surge on entry |
| DEF | Pullback | $48.50 | $52.00 / $54.00 | < $47.50 | Bounce off 50-day MA |
| GHI | Reversal | $112.50 | $118.00 | > $115.50 | Reversal hammer pattern confirmation |
| XYZ | Short / Fade | $37.50 | $34.00 | > $39.20 | Weak sector, poor accumulation heatmap |
(These are illustrative; update with real tickers and calibration per market day.)
Forex Trade Ideas
- EUR/USD – Mean Reversion
- Entry: 1.0650–1.0670 zone
- Target: 1.0750
- Stop: 1.0600
- USD/JPY – Momentum continuation
- Entry: Break above 155.00
- Target: 157.00
- Stop: 154.20
- AUD/USD – Trend following
- Entry: Bounce off 0.6400 support
- Target: 0.6700
- Stop: 0.6350
Crypto Trade Ideas
- BTC/USDT — Breakout play
- Entry: > $37,000 with volume confirmation
- Target: $40,500
- Stop: $35,500
- ETH/USDT — Retest setup
- Entry: Bounce near $2,200 support
- Target: $2,500
- Stop: $2,100
- Altcoin momentum picks
- Choose 2–3 high beta alts showing strong accumulation
- Entry on 1.5–2× volume break
- Limit exposure to 1–2% of portfolio per trade
Risk Management & Positioning Tips
- Position sizing: Never risk more than 1–2% of capital per trade
- Diversification across asset classes: don’t overleverage one sector (e.g. all growth stocks or crypto)
- Use stop orders or mental exit zones: avoid emotional decisions
- Trailing stops vs fixed targets: choose based on volatility regime
- Hedging: consider hedges via options or inverse ETFs if macro uncertainty spikes
- Leverage awareness: in volatile days (especially in crypto/FX), lower leverage is safer
- Sleep on it: if setup is ambiguous, skip the trade — capital preservation is priority
Wrap & What to Watch
Today’s key themes to monitor:
- Any re-emergence of macro data — retail sales, factory indices, credit spreads
- Fed docket: speeches, minutes, or any surprises
- Treasury auction performance and yield curve movement
- Sector rotation — whether leadership broadens beyond tech
- Volatility flows — whether VIX breaks out
- FX reversals or extensions — spurred by rate or geopolitical shifts
- Crypto’s correlation with equities & yield moves
Conclusion:
Markets are treading carefully in a data drought caused by the shutdown, making them more sensitive to narrative, flows, and technical thresholds. In such an environment, disciplined setups, breadth confirmation, and multi-asset awareness will distinguish winners from weak hands. Use this live-playbook as your anchor and adapt to intraday signals.
Appendix & Resources
Data Sources & Widgets
- Real-time index & futures tickers
- Breadth dashboards (advance/decline, new highs/lows)
- Volume heatmaps & flow analytics
- Option chain skew & put/call ratio
- Treasury yield curve dashboard
- FX volatility surface
- Crypto open interest / futures basis tools
Further Reading & Authority Signals
- Research from major banks (Goldman Sachs, JP Morgan)
- Studies on market microstructure & liquidity
- White papers on multi-asset correlation & regime changes
- Authoritative sources: Bloomberg, FT, Barron’s, academic journals
SEO & Ranking Strategy Notes (behind the scenes)
- Keyword targeting: terms like “stock market live updates,” “today’s market drivers,” “tech vs cyclicals rotation,” “equity trade setups,” “forex & crypto correlation”
- Header structure & keyword placement: H1, H2, H3 with targeted phrases
- Depth + uniqueness: combining equities, FX, crypto, trade ideas, risk management
- Internal linking (on a site): link to past live updates, sector analysis, education pages
- Fresh updates / dynamic content: modifying “live” sections intraday to reflect the action
- User engagement signals: charts, tables, annotated images, interactive tools
- Backlinkability: strong original insights, data, and trade ideas encourage external references


 XAUT-USD
 AMD
AMD MARA
MARA SHOP
SHOP BULL
BULL CL=F
CL=F