
The Bombay Stock Exchange (BSE Ltd) is not just a listed entity — it’s one of India’s most pivotal market infrastructure companies. Monitoring the Bombay Stock Exchange share price is essential for investors as it reflects the health of the oldest stock exchange in Asia (founded in 1875) and a key pillar of India’s capital markets ecosystem. BSE plays a dual role: as a marketplace operator and as a listed company itself.
For traders, investors, analysts, understanding BSE Ltd’s stock behavior is akin to understanding the health of India’s broader financial markets. This article dives deeply into BSE Ltd’s performance, fundamentals, challenges, and future outlook — equipping you to make a more informed decision.
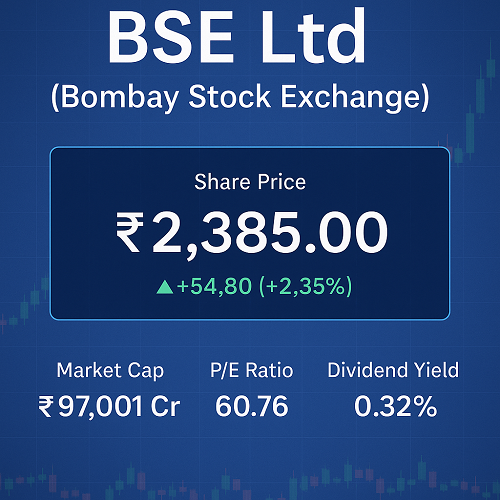
Latest Share Price & Market Snapshot
Below is an illustrative snapshot (as of the latest available update). Always cross-check live data before executing trades.
| Metric | Value |
|---|---|
| Current Price (₹) | ~ ₹2,385.00 |
| Change (1D) | +54.80 (≈ +2.35%) |
| Prev Close | ₹2,330.20 |
| Volume | 7,275,253 shares |
| Total Traded Value | ₹1,735 Cr |
| Upper Circuit | ₹2,623.50 |
| Lower Circuit | ₹2,146.50 |
Fundamental Snapshot
- Market Cap: ~ ₹97,001 Cr
- P/E (TTM): 60.76x
- EPS (TTM): ₹39.25
- P/B Ratio: 21.93x
- Dividend Yield: ~0.32%
- ROE: 29.97%
- Debt/Equity: 0.00 (net zero debt)
These numbers suggest a high-growth, premium valuation stock. But high valuation alone is not enough — the business fundamentals, growth runway, risks, and comparative context all matter.
Company Overview & History
Origins & Legacy
- BSE Limited (formerly Bombay Stock Exchange) was founded on 9 July 1875, making it Asia’s oldest stock exchange.
- Over time, BSE evolved from a local gathering of stock brokers to a modern, electronic, multi-asset exchange platform.
Core Functions
As a listed company, BSE’s operations fall into several verticals:
- Equity trading, derivatives, debt markets
- Mutual fund distribution infrastructure, clearing & settlement
- Market data & indices licensing
- Technology services, connectivity, surveillance
- Issuer services, i.e. IPO, listing, listing compliance
Leadership & Governance
- MD/CEO: Sundararaman Ramamurthy
- BSE is governed by a board that includes independent directors, and operates under SEBI oversight as an exchange entity.
Because BSE is both a marketplace and market participant (via listed entity), it faces potential conflicts and must adhere to strict principles of transparency and regulated arm’s-length operations.
Business Model & Revenue Streams
Understanding how BSE Ltd makes money is critical to assessing its long-term prospects.
Trading & Transaction Fees
- A significant slice of BSE’s revenue is from transaction charges (equities, derivatives, debt) paid by participants.
- Volatility, volumes, and trading activity directly influence this income stream.
Membership, Listing & Issuer Fees
- Entities wanting to list on BSE pay listing and compliance fees.
- BSE also charges fees for services like corporate actions, depository services, and issuer support.
Data & Technology Licensing
- BSE generates recurring revenue from market data subscriptions, index licensing, and sale of analytics to brokers, institutions, and media.
Surveillance, Risk & Infrastructure Services
- Given its role in maintaining market integrity, BSE offers surveillance services, clearing services, and risk-management infrastructure, which also contribute to revenue.
Other Ventures & Expansion
- BSE may, over time, expand into new financial service verticals (e.g. fintech collaborations, cloud services) as regulatory boundaries allow.
The combination of recurring, transaction-linked, and licensing revenues positions BSE to scale as market volumes grow.
Financial Analysis & Key Ratios
We now dive into BSE Ltd’s financial performance, margins, growth trends, and ratios — crucial to calibrate valuation assumptions.
Income Statement Trends & Margins
From Groww’s published financials:
| Quarter | Revenue (₹ Cr) | Expenses (₹ Cr) | EBITDA (₹ Cr) | Net Profit (₹ Cr) | Net Margin |
|---|---|---|---|---|---|
| Jun ’24 | 551.51 | 319.88 | 250.55 | 173.26 | 34.9% |
| Sep ’24 | 754.63 | 379.77 | 398.13 | 281.72 | 37.7% |
| Dec ’24 | 739.40 | 338.68 | 424.96 | 260.16 | 35.2% |
| Mar ’25 | 867.21 | 309.26 | 582.01 | 397.31 | 45.8% |
| Jun ’25 | 948.37 | 338.22 | 632.05 | 468.40 | 49.4% |
Observations:
- BSE has shown accelerating profit margins, especially in the trailing quarters.
- The cost base appears relatively stable, enabling leverage as revenues grow.
- The net margin expanding from ~35% to ~50% is an impressive performance for an exchange.
Ratio & Return Metrics
- Return on Equity (ROE): ~29.97%
- P/E (TTM): 60.76x
- P/B Ratio: 21.93x
- Debt to Equity: 0.00 – BSE is net debt-free
- Dividend Yield: Low (~0.32%)
These ratios indicate the stock is priced richly, likely factoring in expectations of significant growth and dominance in India’s exchange landscape.
Shareholding Pattern & Institutional Interest
Understanding who owns the stock gives insight into investor confidence, potential insider moves, and institutional endorsement.
From Groww’s shareholding data, as of latest:
- Retail & Others: 63.65%
- Foreign Institutional Investors (FIIs): 22.84%
- Mutual Funds: 11.57%
- Other Domestic Institutions: 1.94%
The high retail share signals broad public participation, while meaningful FII and mutual fund presence suggests institutional confidence.
Also noteworthy: the top mutual fund investments include Invesco, ICICI Prudential, Tata Retirement Funds, etc.
This mix gives BSE a balanced base of support from both retail and institutional holders, which can aid liquidity and stability.
Peer Comparison & Competitive Landscape
To assess valuation and growth potential, it’s helpful to compare BSE with relevant peers and contextual benchmarks.
Key Peers / Alternatives
- NSE (National Stock Exchange of India) – though not directly listed, NSE is BSE’s primary rival in India’s exchange ecosystem.
- MCX, CDSL, NSDL, other exchange or depository infrastructure plays
- Global exchanges (e.g., Nasdaq, B3, LSE) for valuation anchoring
- Non-exchange tech platforms in fintech and data licensing
Comparative Metrics
| Entity | P/E | Growth Outlook | Margins / Moat Strength |
|---|---|---|---|
| BSE Ltd | ~60.8x | High growth via volume expansion, data licensing | Strong margins, zero debt |
| Other Indian exchange / infrastructure | Usually lower multiples (due to regulatory risk, less diversification) | Varies | Often more exposure to cyclical volumes |
Because BSE is a mature infrastructure business with recurring licensing and data streams, it commands premium multiples in expectation of durability and margin resilience.
Strengths vs. Challenges
Strengths:
- Deep moat — control of core exchange infrastructure
- Diversified income beyond pure trading
- Reputation, regulatory alignment, and legacy credibility
Challenges:
- Cyclicality in volumes and market activity
- Regulatory risk (SEBI and govt policy)
- Technology disruption, new platforms, fintech encroachment
Technical Analysis & Price Forecast
While fundamentals guide long-term value, technicals help with entry timing, support zones, and risk management.
Price Patterns & Support/Resistance
- Support zone (range): likely between ₹2,100 – ₹2,300
- Resistance zone: near the upper circuit (~₹2,600) and potentially higher as momentum builds
- Watch for breakouts on volume above resistance, or breakdowns below support.
Moving Averages & Trend
- 50-day and 200-day SMA/EMA trends
- If the price remains above its 200-day MA, that underscores a bullish medium-term trend
- Crossovers (50-day crossing 200-day) or divergences in momentum indicators (RSI, MACD) are signals to watch.
Forecast Scenarios (Speculative)
- Base case (6–12 months): 10–25% upside from current levels if volumes hold and BSE sustains margin growth
- Bull case: 30–50% upside if there is a structural rise in retail trading, data licensing demand, or strategic acquisitions
- Bear case: 10–20% downside if volumes drop, regulatory tightening, or competition escalates
Note: These forecasts are indicative and must be adjusted for real-time data.
Risks & Catalysts
Key Risks to Watch
- Volume Volatility / Market Downturns – As an exchange, BSE’s revenue is tied to trading activity.
- Regulatory / Policy Intervention – Changes in listing rules, transaction taxes, or surveillance norms.
- Technological Disruption – New fintech or blockchain-based trading platforms could erode margins.
- Concentration Risk – Revenue dependency on a few segments or products.
- Competition Pressure – From NSE, unlisted exchanges, or alternate trading schemes.
Major Catalysts
- Surge in retail participation or derivatives growth
- New licensing deals, technology contracts, or data monetization
- Expansion into adjacent services (e.g. fintech, cloud, indices)
- Strategic acquisitions or JV’s that unlock new markets
A catalyst-driven move in volumes or licensing could prompt re-rating of BSE’s multiples.
Investment Thesis & Valuation
Summary Thesis
BSE Ltd is a rare dual-character stock — it operates as core market infrastructure while also being a pure investment asset. The fundamentals are strong: zero debt, expanding margins, recurring licensing income, and a credible institution behind it. Given India’s rising capital markets participation, BSE is well positioned to ride the secular wave.
Valuation Approach
Relative Multiples Method:
- Using P/E multiple of ~50–70x on projected normalized earnings
- Compare with peer infrastructure / exchange multiples (domestic and international)
Discounted Cash Flow (DCF) Approach (simplified):
- Project revenue growth of ~10–20% annually (driven by volume and data licensing)
- Use operating margin ~45–50%
- Discount at a cost of equity ~10–12%
- Add terminal growth ~3–5%
Given the premium valuation already ascribed, margin of safety is critical. A prudent investor might wait for consolidation, pullbacks, or strong earnings beats as entry triggers.
How to Trade / Invest in BSE Ltd
Platforms & Exchanges
- BSE Ltd is traded on both BSE and NSE — use a brokerage of your choice that offers access to both.
- Intraday, delivery, or as part of a longer-term portfolio strategy
Order Types & Strategies
- Use limit orders to manage price execution
- For volatile days, consider stop-loss and trailing stops
- On breakout moves, explore momentum breakout entries if volume confirms
Risk Management
- Allocate only a portion of your capital (e.g. 3–5%) to any single stock
- Use stop-loss levels just below support zones
- Regularly monitor volume, news, and regulatory developments
FAQs
Q: Is BSE Ltd a good long-term hold?
A: If India’s capital markets continue to deepen and trading volumes rise, BSE has structural tailwinds. But you must tolerate valuation risk and regulatory exposures.
Q: What are realistic return expectations?
A: A well-chosen entry may yield 15–25% CAGR over 3–5 years, assuming positive execution and market growth.
Q: Should I use margin or derivatives when trading BSE?
A: Only as part of a defined risk strategy. Given its high valuation, avoid over-leveraging unless you have clear signals.
Q: How does BSE compare to NSE?
A: NSE captures more volume in India, but BSE’s infrastructure and listing services also give it unique revenue lines. The exchange competition dynamic is complex.
Q: Where can I find BSE’s latest results and disclosures?
A: On BSE’s official website, in SEBI filings, and via financial platforms. Always refer to audited quarterly and annual reports.
Conclusion
BSE Ltd is not just another stock — it’s central to India’s capital markets architecture. With a debt-free balance sheet, expanding margins, credible shareholding base, and multiple growth levers, BSE offers a compelling growth + stability play. That said, its premium valuation demands discipline — waiting for confirmation, pullbacks, or earnings surprises is prudent.

 XAUT-USD
 AMD
AMD JNJ
JNJ MARA
MARA SHOP
SHOP UNH
UNH BULL
BULL EURUSD=X
 CL=F
CL=F