
As of November 2025, Berkshire Hathaway Inc. Class B (NYSE: BRK.B) remains one of the most institutionally trusted equities in the U.S. market. The Berkshire Hathaway B stock price reflects its known diversified exposure, fortress balance sheet, and Buffett-driven value discipline. BRK.B continues to outperform most actively managed funds through cyclical environments.
While the stock underperformed growth-heavy benchmarks like QQQ during the 2020-2023 tech cycle, its risk-adjusted returns, low beta, and intrinsic compounding power have made it a consistent alpha contributor to long-term portfolios.
This analysis provides a deep-quantitative review of BRK.B’s fundamentals, technical landscape, valuation trajectory, and hedge fund positioning—complete with short- and long-term forecasts through 2026.
Company Overview
Berkshire Hathaway, founded by Warren E. Buffett and Charlie Munger, operates as a diversified conglomerate spanning insurance, energy, transportation, manufacturing, retail, and financial services.
Key subsidiaries and holdings include:
- GEICO, Berkshire Reinsurance, and General Re (insurance)
- BNSF Railway (transportation)
- Berkshire Hathaway Energy (utilities/infrastructure)
- Major equity holdings: Apple Inc., American Express, Coca-Cola, Chevron, Occidental Petroleum, and Bank of America
This cross-sector exposure allows Berkshire to operate as a quasi-ETF of U.S. corporate strength, balancing cyclical and defensive plays with limited reliance on any single macro theme.
Fundamental Analysis (2025 Outlook)
Earnings and Valuation Snapshot
| Metric | Value (TTM 2025) | Context |
|---|---|---|
| EPS | ~$19.80 | up +6 % YoY |
| P/E Ratio | ~17× | below S&P 500 average of 21× |
| P/B Ratio | ~1.55× | historically fair for Berkshire |
| ROE | ~9.2 % | steady capital efficiency |
| Free Cash Flow | ~$36 B annualized | massive buyback capacity |
Valuation interpretation: BRK.B remains slightly undervalued relative to intrinsic worth, trading near the midpoint of its historical P/B range (1.3–1.7×). Given its buyback authorization and retained-earnings model, intrinsic compounding continues independent of dividend yield.
Balance Sheet and Cash Position
Berkshire’s cash reserves, estimated around $175 billion, provide unmatched flexibility. This capital war chest supports opportunistic share repurchases and tactical acquisitions during market drawdowns.
Buffett’s conservative capital allocation keeps leverage minimal—debt-to-equity below 0.25, reinforcing downside stability and AAA-level credit resilience.
Insurance Float Dynamics
Insurance operations generate a self-funded “float” exceeding $160 billion, which Berkshire deploys into equities and fixed-income assets. In a higher-rate environment, this float now yields positive carry, amplifying earnings potential without incremental risk.
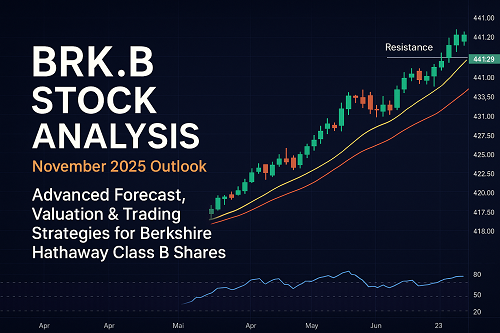
Technical Analysis (November 2025)
Trend Structure
- Primary trend: Bullish continuation since the Q2 2024 breakout above $395.
- Support zones: $395 (primary), $382 (secondary 50-DMA region).
- Resistance zone: $452–$460 range (previous ATH).
Moving Averages:
- 20-DMA = $440
- 50-DMA = $420
- 200-DMA = $392
The price structure remains above all key moving averages—confirming sustained institutional support.
Momentum and Volume
- RSI (14): 63 — bullish but not overbought.
- MACD: Positive cross since October 2025.
- Volume Profile: High accumulation near $410–$425 suggests strong buy-the-dip activity.
Market Breadth & Relative Strength
BRK.B shows positive divergence versus SPY (+3 % outperformance YTD) and QQQ (–6 % relative underperformance) — a classic rotation into value and defensive conglomerates.
Institutional & Hedge Fund Positioning
13F filings through Q3 2025 show increased allocations from major pension funds and value-focused hedge funds. Notable trends:
- Vanguard Group and BlackRock maintain > 9 % combined ownership.
- Berkshire’s own buyback program reduced float by ~1.5 % YTD.
- Institutional holders favor BRK.B as a defensive equity proxy with bond-like volatility and equity-like returns.
Macroeconomic Context
Interest Rates and Inflation
As the Fed stabilizes rates around 3.75 %, Berkshire’s portfolio benefits from higher fixed-income yields on its cash reserves. Inflation cooling below 2.5 % supports real earnings growth for its industrial and energy subsidiaries.
Equity Market Rotation
The 2024-2025 rotation out of mega-cap tech and into value sectors has improved relative flows into BRK.B, which functions as a low-correlation anchor in balanced portfolios.
BRK.B’s Sharpe ratio (0.87) over the past three years exceeds SPY’s 0.71 and far outpaces QQQ’s 0.55, demonstrating strong risk-adjusted performance.
Forecast Scenarios
Short-Term (3–6 Months)
| Scenario | Target Range | Probability | Catalyst |
|---|---|---|---|
| Bullish | $455 – $470 | 60 % | Continued buybacks, earnings beat |
| Neutral | $420 – $440 | 30 % | Sideways macro data, Fed pause |
| Bearish | $385 – $400 | 10 % | Unexpected credit tightening |
Short-term view: Momentum favors a measured rally toward the $460 zone by Q1 2026 if broader equities hold their trend.
Long-Term (12–24 Months)
Intrinsic valuation models based on earnings growth and book value appreciation project a fair value target of $490–$520 by late 2026.
Long-term drivers:
- Compounding insurance float yield
- Share repurchases at discounted book ratios
- Stable EPS growth from Apple and energy exposure
Bear case valuation (~$400) requires a major macroeconomic recession or portfolio mark-to-market losses—currently a low-probability event.
Risk Factors & Hedge Considerations
- Equity Concentration Risk: Apple remains ~45 % of the public portfolio value.
- Succession Risk: Leadership transition from Buffett and Munger to Greg Abel and Ajit Jain is underway; market perception is stable but sensitive.
- Interest Rate Risk: A sudden reversal to higher rates could pressure industrial subsidiaries.
- Regulatory Exposure: Insurance and energy segments face ESG and compliance cost risks.
Hedging strategies for advanced traders:
- Collar hedge: Buy protective puts at $400 while selling covered calls at $475.
- Pairs trade: Long BRK.B / short SPY as a defensive spread during corrections.
- Futures overlay: Hedge systematic beta with E-mini S&P futures to maintain alpha exposure.
Comparative Benchmark Analysis
| Symbol | YTD Return | Beta (5Y) | P/E | Dividend | Sharpe (3Y) |
|---|---|---|---|---|---|
| BRK.B | +11.2 % | 0.62 | 17× | 0 % (reinvested) | 0.87 |
| BRK.A | +10.9 % | 0.61 | 17× | 0 % | 0.86 |
| SPY | +8.4 % | 1.00 | 21× | 1.4 % | 0.71 |
| QQQ | +5.6 % | 1.12 | 28× | 0.7 % | 0.55 |
| AAPL | +9.1 % | 1.26 | 29× | 0.6 % | 0.58 |
Berkshire’s lower beta and higher Sharpe ratio reinforce its appeal for risk-balanced portfolios, particularly when paired with growth exposure from QQQ or AAPL.
Trading Strategy Insights for Advanced Traders
- Swing Strategy: Enter on pullbacks to the 50-DMA ($420–$425), target $455+, stop below $410.
- Position Trading: Scale entries in tranches near P/B ≤ 1.5× (book ≈ $270/share).
- Options Play: Sell cash-secured puts at $400 to capture theta while accumulating shares on weakness.
- Long-term Portfolio Core: Reinvest via tax-advantaged accounts; BRK.B’s internal compounding outpaces most dividend funds over 10-year periods.
Conclusion & Valuation Summary
| Metric | Status (Nov 2025) | Bias |
|---|---|---|
| Technical Trend | Bullish above $420 | ✅ |
| P/B Ratio | 1.55× (fair) | Neutral |
| Cash Reserves | $175 B+ | ✅ |
| Earnings Growth | Mid-single digits | ✅ |
| Risk Profile | Low Beta (0.62) | ✅ |
| Short-Term Target | $460 | ✅ |
| Long-Term Target | $490–$520 | ✅ |
Final Verdict: BRK.B remains a core defensive holding for advanced portfolios seeking alpha through value, buybacks, and compound growth. Short-term momentum supports a Q1 2026 test of $460, with multi-year upside toward $500+ if macro stability persists.
FAQ (SEO/Schema Ready)
Q1. Is BRK.B undervalued in November 2025?
A: Yes. Its P/B of ~1.55× and forward P/E of ~17× are within value range, suggesting moderate undervaluation relative to intrinsic growth.
Q2. What is the difference between BRK.A and BRK.B?
A: BRK.A is the original Class A share trading above $600,000 per share; BRK.B offers fractional ownership with 1/1500 voting rights and easier liquidity for retail investors.
Q3. Does Berkshire pay dividends?
A: No. It retains earnings for reinvestment and share buybacks—historically a superior allocation strategy under Buffett.
Q4. Is BRK.B suitable for short-term trading?
A: Yes, but with modest volatility. It trends best under swing and position trading strategies due to its institutional flow consistency.
Q5. What are the long-term price targets for BRK.B?
A: Base case of $490–$520 by late 2026 under steady earnings growth and continued buybacks.
 XAUT-USD
 AMD
AMD JNJ
JNJ MARA
MARA SHOP
SHOP UNH
UNH BULL
BULL EURUSD=X
 CL=F
CL=F