
The Dow Jones Industrial Average (DJIA), commonly referred to as “the Dow,” is one of the oldest, most-watched stock indices in the world. It tracks 30 large, publicly traded U.S. companies and serves as a barometer for the overall health of the U.S. stock market and economy.
The ticker .DJI is often used on major financial news sites (e.g. CNBC) to represent the real-time quote for the DJIA.
In this guide, you will find:
- Live quote and chart data (with explanations)
- How the DJIA is calculated
- Historical performance and key milestones
- Major drivers and trading signals
- How to trade around or benchmark the DJIA
- Risks, limitations, and alternatives
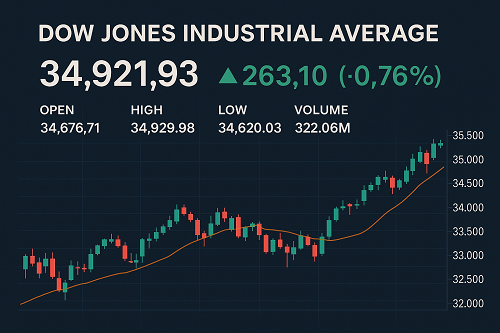
Live Quote & Chart — Understanding the Snapshot
| Metric | Meaning |
|---|---|
| Current Level | The latest index value for the DJIA, based on aggregated component prices. |
| Change (pts / %) | Difference from previous close, showing whether the index is up or down. |
| Opening / High / Low | The opening index, and intraday extremes. |
| Volume / Breadth | Total volume or number of advancing vs. declining stocks among components. |
| Historical Chart | Enables visualization of price movement across timeframes (1m, 5m, daily, weekly). |
Note: Many finance platforms (e.g. Yahoo Finance, Investing.com) present live DJIA data with built-in charts and related metrics.
Because the DJIA is price-weighted (unlike many market-cap indices), high-priced stocks carry more influence in its movement.
How the DJIA Is Calculated
Understanding the index’s construction is key to interpreting its moves:
- Price-Weighted Index Model
Each component’s share price is summed and divided by a divisor (the Dow divisor) to normalize scale and handle structural changes. - The Dow Divisor
This divisor is adjusted for stock splits, spin-offs, and component changes so the index reflects pure price performance rather than mechanical jumps. - Component Changes
The 30 DJIA stocks are selected by editors at S&P Dow Jones Indices. Changes occur to maintain representation of U.S. industry sectors.
Because it’s price-weighted, a $1 change in a $500 stock moves the index more than a $1 change in a $50 stock.
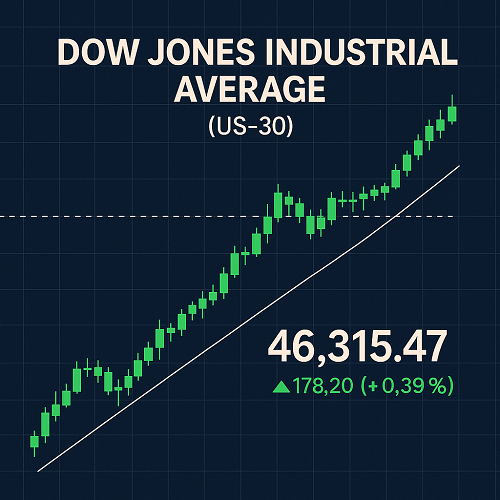
Historical Performance & Key Milestones
Long-Term Growth
The DJIA has steadily advanced over decades, reflecting U.S. economic expansion, technological innovation, and corporate profitability.
Milestone Closes & Records
- In 2025, the DJIA achieved record closing highs above 46,381.54.
- The index has passed major round-number thresholds (e.g. 10,000; 20,000; 30,000; 40,000) in its history.
- Historically, its largest daily point drop occurred on March 16, 2020, when it fell ~2,997 points.
- One of the biggest single-day gains was ~2,963 points in April 2025.
For a detailed list of major one-day swings, see “List of Largest Daily Changes in the Dow Jones Industrial Average.”
What Drives the Dow? Key Catalysts
Macroeconomic Indicators
- Federal Reserve policy & interest rates
- Inflation data (CPI / PCE)
- GDP growth / unemployment / consumer spending
Corporate Earnings & Guidance
Since DJIA components are large-cap stalwarts, their earnings trends heavily influence the index.
Sector Rotation & Leadership
Though only 30 names, changes among sectors (industrial, tech, financial, health) shift momentum.
Market Sentiment, Geopolitics & External Shocks
Crises, trade policy, global central bank moves, or systemic events often trigger sharp DJIA moves.
Technical Levels & Momentum
Support and resistance zones, trendlines, moving averages, relative strength comparisons play a role in short-term trading.
How to Trade / Use the DJIA
As a Benchmark
Many funds and portfolios use the DJIA as a performance benchmark, comparing their returns to the index.
Index Futures & Options
You can trade Dow futures (e.g. via CME E-mini Dow futures) and options on Dow indices or ETFs to express directional views.
ETFs & Funds
Examples include SPDR Dow Jones Industrial Average ETF (DIA), which mirrors the performance of the DJIA practically.
Pair Trades & Correlation Strategies
Some traders pair the DJIA vs. S&P 500 or Nasdaq to exploit relative strength or divergence.
Interpreting DJIA Movements — Signals & Strategy
Trend Analysis
- Use moving averages (20-day, 50-day, 200-day) to detect trend direction
- Watch breakouts / breakdowns at key support or resistance zones
Breadth & Internals
- Since DJIA is just 30 stocks, look at advance/decline data across the broader market for confirmation
- Volume and momentum indicators help confirm moves
Volatility & Risk Control
- Monitor the VIX (volatility index) as a proxy for market stress
- Always set stop-losses given the potentially sharp swings
Event-Based Strategies
- Before Fed decisions, earnings seasons, or economic releases, volatility tends to rise
- Use straddle / strangle options strategies around these periods
Limitations & Criticisms
- Price-Weighting Distortion
High-priced stocks disproportionately affect index moves, regardless of company size. - Limited Universe
Only 30 companies — misses smaller-cap growth trends represented by S&P / Nasdaq. - Lack of Sector Representativeness
Some sectors (e.g. tech, growth) are underweighted compared with modern markets. - Not Total Return
DJIA does not include dividends — a total return version must be calculated separately.
Thus, many analysts prefer the S&P 500 or Nasdaq Composite for broader market insight.
DJIA vs. S&P 500 vs. Nasdaq — Comparative Overview
| Index | Weighting Method | Number of Constituents | Best Use Case / Edge |
|---|---|---|---|
| DJIA / .DJI | Price-weighted | 30 | A blue-chip “pulse” index widely tracked in media |
| S&P 500 | Cap-weighted | 500 | Broader U.S. market exposure, favored in professional analysis |
| Nasdaq Composite | Cap-weighted | 3,000+ | Tech / growth leverage and innovation exposure |
For long-term investing or macro views, S&P 500 often offers a more representative measure of the U.S. equity market.
Frequently Asked Questions
Q: Why is the DJIA often behind in performance compared to Nasdaq or S&P 500?
A: Because it has fewer high-growth tech names, and its price-weighting distorts true company size representation.
Q: How often do they change the 30 DJIA components?
A: Component changes are infrequent. The DJIA committee may swap companies to ensure sector balance and relevance.
Q: Does the DJI reflect dividends?
A: No, the standard DJIA is a price index. A separate DJIA Total Return series includes dividends.
Q: Can I trade the .DJI symbol directly?
A: No — .DJI is a ticker display. You trade derivatives, ETFs, futures, or options tied to the index.
Conclusion
If you want to beat or outrank a CNBC-style “.DJI quote” page, your site needs:
- Accurate, up-to-date DJIA data & charting
- In-depth explanatory sections (history, calculation, components)
- Actionable trading insights & best practices
- Comparisons vs. other indices
- SEO focus on long-tail keywords:
- “DJIA live quote”
- “.DJI real time data”
- “Dow Jones calculation explained”
- “How to trade Dow futures”
- “DJIA vs S&P 500 analysis”


 XAUT-USD
  AMD
AMD  JNJ
JNJ  MARA
MARA  SHOP
SHOP  UNH
UNH  BULL
BULL  EURUSD=X
  CL=F
CL=F