
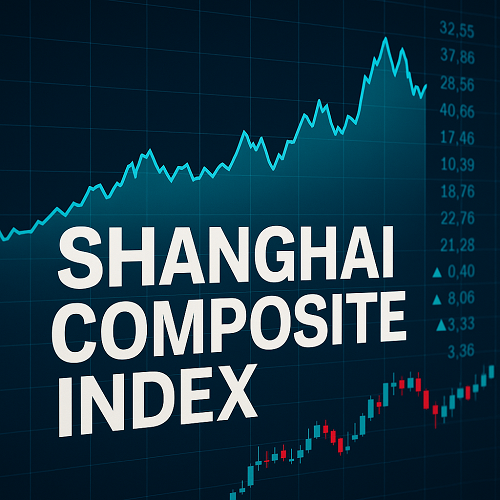
What Is the Shanghai Composite Index (SSEC)?
- The Shanghai Composite Index, also known by its ticker .SSEC or 000001.SS, is a broad‐market index which tracks all A-shares and B-shares listed on the Shanghai Stock Exchange (SSE).
- It is often used as a barometer for the health of the Chinese mainland stock market, especially for China’s domestic economy.
Key definitions:
- A-shares: Stocks in Shanghai (or Shenzhen) denominated in Chinese yuan (CNY), without foreign restrictions (though some foreign access through QFII, Stock Connect, etc.).
- B-shares: Stocks denominated in foreign currencies or tradable by foreigners under specific regulations. Over time, their relative importance has diminished in many investors’ view.
History & Base Calculation
| Item | Details |
|---|---|
| Inception / Base Date | The SSE Composite was established in 1991. Its base value is set according to a base period (around December 1990) with base value 100. |
| Index Type | It is a composite price index, meaning it measures price movements of its component securities, not adjusted for dividends. It includes both A and B share classes. |
| Weighting | The SSE Composite is market-cap weighted, but because it includes a huge number of firms (many small, many large; many state-owned), weighting skew often occurs toward large financials and state-owned enterprises. |
Constituents & Composition
- The index includes all companies listed on the Shanghai Stock Exchange (both A & B shares). As of recent data, that means well over 1,400-1,500 listings.
- Sector breakdown tends to have heavy weighting toward Financials, Industrials, Materials, with others like Consumer Staples, Technology growing but less dominant.
- Because many state-owned or state-influenced firms are in the index, sectors intertwined with government policy (banks, utilities, infrastructure) often carry outsized influence.
How SSEC is Traded & Who Tracks It
- It is not directly tradable: You cannot buy “the index” per se; rather, you invest via ETFs or funds which attempt to replicate its performance.
- Access for foreign investors has expanded through mechanisms like Stock Connect, Qualified Foreign Institutional Investor (QFII), Renminbi Qualified Foreign Institutional Investor (RQFII) etc.
- Data providers: Investing.com, Yahoo Finance, Google Finance, Trading Economics, LiveIndex etc., track real-time and historical prices.
Recent Performance & Key Drivers
A. Recent Data (as of latest)
- As of recently, the index is trading in the ~3,800 CNY range.
- Its 52-week range spans roughly 2,700 to 3,900 points, showing significant volatility year-on-year.
B. Key Drivers
- Government policy / regulation: Stimulus, interest rate decisions, property sector regulation, restrictions on certain industries (tech, education, etc.).
- Monetary policy & liquidity: Actions by the People’s Bank of China (PBOC), lending rates, reserve requirement ratio (RRR) changes.
- Trade relations / external environment: U.S.-China relations, export demand, global supply chains.
- Domestic macro indicators: GDP growth, industrial production, property market health.
- Foreign capital inflows/ outflows: Via Stock Connect, foreign institutional interest etc.
Notable events:
- In August 2025, the Shanghai Composite reached highs not seen since 2015, driven largely by fintech and stablecoin-related stocks.
- Earlier rise in anticipation of favorable Sino-U.S. trade developments boosted investor sentiment.
Technical Analysis & Patterns
- Support & Resistance Levels
- Resistance near recent highs ~3,900 (52-week highs).
- Support zones around prior swing lows (~2,700-3,000) and intermediate support near 3,500-3,700.
- Moving Averages
- Short-term MA (20-50 day) often signals momentum; crossing above 50-day MA indicates bullish trend.
- Long-term MA (200 day) is a major trend filter.
- Volatility
- The index is fairly volatile, especially around policy announcements. Events like regulatory crackdowns, trade policies, macro surprises often cause sharp swings.
- Chart Patterns
- Possible consolidation or range trading when policy is uncertain.
- Breakouts typically occur when government actions or external pressures reduce uncertainty.
Fundamental & Economic Factors Affecting SSEC
| Factor | Why It Matters |
|---|---|
| Interest Rates / Lending Costs | Higher rates reduce corporate profit margins, depress credit-sensitive sectors. Low rates often stimulate growth. |
| Property Market Health | Real estate is a large component of China’s economy. Weakness can hurt banks, construction firms, local government finances. |
| Regulation of Key Sectors | Tech, education, health, real estate etc. have been subject to heavy regulation. Regulatory risk is high. |
| Domestic Consumption Trends | The shift toward consumer-driven growth (vs export/manufacturing) impacts consumption, retail, services sectors in the index. |
| Currency and Capital Flows | Yuan policy, foreign investment restrictions or loosening, impact inflows/outflows and investor confidence. |
| Global Trade and Demand | Exports, supply chain disruptions, global demand for Chinese goods affect industrials, materials. |
| Inflation, Employment, Supply-side Shocks | Manufacturing PMI, CPI, PPI, etc. Also, agriculture, energy shortages can feed into costs. |
Risks and Considerations for Investors
- Policy Risk / Government Intervention: The Chinese government can and does intervene (e.g. lending, market arrests, regulation changes). This can produce rapid reversals.
- Transparency & Governance: Some listed companies have opaque ownership, state involvement, or may be subject to political objectives.
- Currency Risk: For foreign investors, changes in yuan value can affect returns when converted orhedgedor hedgedorhedged.
- Liquidity Risk: While large cap names are liquid, smaller stocks may have low liquidity.
- Foreign Access Limitations: Although access has improved, foreign ownership caps, regulatory restrictions may apply.
- Valuation and Over-Exuberance: High valuations in certain sectors (like tech or real estate) may expose downside.
How to Gain Exposure
- ETFs / Index Funds: Funds that track the SSE Composite or its sub-indices. Can be local Chinese funds, or international ETFs that hold derivative contracts or via Stock Connect.
- Mutual Funds / Managed Funds: Some mutual funds focus on China A-shares.
- Leveraged Instruments / Derivatives: Futures, options (if available). Beware of leverage risks.
- Direct Investment in A/B shares: Via stock brokers that provide access through regulated channels (Stock Connect etc.).
Sample Trading / Investment Strategies
| Strategy | Description | Time Horizon |
|---|---|---|
| Trend Following | Follow breakouts above resistance (e.g. 3,900+), ride momentum while staying alert to reversals. Use moving averages as filters. | Medium (weeks to months) |
| Mean Reversion / Range Trading | If price is oscillating between support/resistance, trade the ranges (buy low, sell high) while controlling for breaks. | Short to Medium |
| Policy Catalyst Plays | Monitor for announcements (stimulus, regulatory easing/tightening) and position ahead or in anticipation. | Short to Medium |
| Long-Term Value Investing | Identify undervalued sectors or companies, with strong fundamentals and stable earnings. | Long (1-5 years+) |
| Hedged Exposure | Use currency hedges, diversify across sectors, or pair with international indices to offset risks. | Medium to Long |
Frequently Asked Questions (FAQ)
| Q | A |
|---|---|
| What is the ticker symbol? | SSEC is the common symbol; in other data services, it is also shown as 000001.SS. |
| Is SSEC price only for A-shares? | No, it includes both A-shares and B-shares listed in Shanghai. |
| Does the index include dividends? | No — it’s a price index. Total return indices or dividend-adjusted indices are separate. |
| Can foreign investors trade it directly? | Increasingly yes, via programs such as Stock Connect, RQFII, etc., though some rules / quotas might still apply. |
| What is the 52-week range? | Roughly CNY 2,700 to ~3,900 in recent data. |
| What major events affect the index? | Policy announcements, trade tensions, global demand, monetary policy, property sector changes. |
Conclusion
The Shanghai Composite Index (SSEC) remains one of the most important gauges of China’s equity market, especially for understanding domestic sentiment, policy impacts, and the performance of major sectors like finance, industrials, and materials. While it offers opportunity, it comes with significant risk from regulatory shifts, policy interventions, and macro headwinds.
For serious investors and traders, combining technical analysis with fundamental drivers is key. Staying aware of policy signals, understanding currency dynamics, and managing exposure are essential to navigating the volatility.
 XAUT-USD
  AMD
AMD  JNJ
JNJ  MARA
MARA  SHOP
SHOP  UNH
UNH  BULL
BULL  EURUSD=X
  CL=F
CL=F