
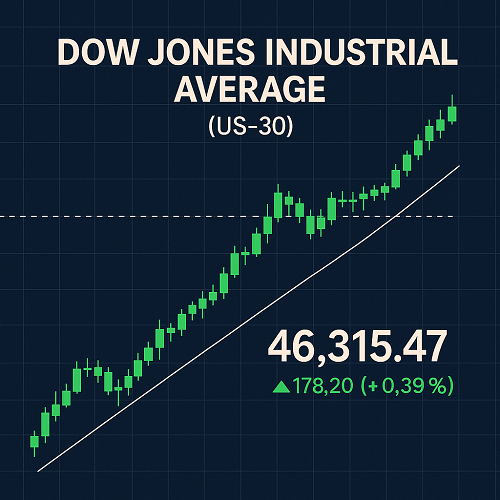
The Dow Jones Industrial Average (often abbreviated as DJIA, “Dow,” or “US-30” in many trading platforms) is a price-weighted average of 30 large, publicly traded U.S. companies, spanning diverse sectors such as tech, finance, industrials, consumer goods, and more. The DJIA index is one of the oldest and most widely followed equity indices in the world, serving as a barometer of the overall health of the U.S. stock market and, by extension, often for global risk sentiment.
- Price-weighted: Unlike market-cap weighted indexes (like the S&P 500), each stock’s impact is proportional to its stock price, not its market value.
- Component turnover is rare, and changes are made only when companies become less representative.
Current Status & Key Metrics (as of September 2025)
Here are the latest figures and ranges for the DJIA:
| Metric | Value / Data |
|---|---|
| Latest Level | ~ 46,315 |
| 52-Week Range | Low: ~ 36,611.78 / High: ~ 46,396.47 |
| Year-to-Date Return (2025) | + ~ 7-9% |
| Daily Trading Range | ~ 46,105.02 to 46,396.47 |
| Technical Rating (Daily) | “Strong Buy” per moving averages and indicators |
These data points show DJIA is near its 52-week high, with a respectable year-to-date gain and bullish signal from technical tools.
Components of the DJIA & Sector Weighting
While the DJIA focuses on 30 large companies, its sector mix and individual company performance matter enormously for both trend & risk.
Key constituents (examples & recent movers)
Some top names include:
- Microsoft, Apple, NVIDIA — strong tech exposure.
- Caterpillar, Chevron — representing industrials and energy.
- UnitedHealth, Visa, JPMorgan — healthcare, finance & consumer segments.
Sector Weighting Insights
- Tech and industrial-related stocks have been major trend leaders.
- Defensive sectors (utilities, consumer staples) tend to lag when interest rates are rising and economic growth is strong.
- The DJIA’s price-weighting means that high‐price stocks like Boeing, Goldman Sachs or Home Depot can have outsized influence.
Major Historical Milestones & Performance in 2025
- The Dow has already reached new record highs in 2025.
- Best single day of the year was +8.6% return on April 9.
- The broader 52-week low to high swing (~36,600 to ~46,400) reflects both volatility and strong recovery.
Technical Analysis
Understanding what the indicators are telling us is essential for traders and investors alike.
Trend Analysis
- Uptrend dominance: price has generally been making higher highs and higher lows since bottoming earlier in the year.
- Momentum has picked up in recent weeks: upward breakouts, close near upper ranges of recent days.
Support & Resistance Levels
| Level | Role / Significance |
|---|---|
| ~ 45,000 – 45,500 | Key support zone (previous resistance turned support) |
| ~ 46,400 – 46,500 | Near‐term resistance / recent high watermark |
| ~ 44,000 | Secondary support round-number psychological level |
| ~ 50,000+ | Long-term upside target but likely strong resistance ahead |
Moving Averages & Oscillators
- 50-day MA has been acting as support in many pullbacks.
- 200-day MA remains well below the current price, which is bullish in long term.
- MACD: Likely showing bullish crossover or continued positive divergence.
- RSI: Near overbought in short-term frames (daily/weekly); indicates possible short-term consolidation.
Fundamental Drivers
It’s not just technicals—fundamentals matter deeply for sustaining trends.
Macro Economy & Inflation
- Inflation remains elevated but has shown signs of moderating. If inflation stays stubborn, it creates headwinds for equities.
- GDP growth in the U.S. is uneven: certain sectors (tech, consumer discretionary) outperform, while industrials and energy may be sensitive to supply chain, input costs.
Interest Rates & Federal Reserve Policy
- The Fed’s interest rate policy is a central factor. Hints of rate cuts or dovish commentary tend to boost equity indices.
- Real yields and bond yield curves are watched closely—steepening or inversion can presage risk.
Corporate Earnings & Big Cap Behavior
- Big-cap tech (Apple, NVIDIA, Microsoft) are pulling more of the weight in returns. Strong earnings, guidance in these firms can lift the index.
- Conversely, weaker performance in financials, industrials, or consumer sectors can drag.
Geopolitical & External Risks
- Supply chain issues, trade tensions, energy shocks (oil/gas) or commodity price volatility can affect the industrial / energy components.
- Global economic slowdowns (China, Europe) could reduce demand for U.S. exports, affecting relevant companies in DJIA.
Forecast & Scenarios (Rest of 2025 → Into 2026)
Below are possible scenarios based on different drivers, plus likely levels.
| Scenario | Drivers | Predicted Range / Outcome |
|---|---|---|
| Base Case (Optimistic but Realistic) | Moderate inflation, at least one Fed rate cut by year-end, corporate earnings hold or beat estimates, no major negative shock. | DJIA drifts toward ~50,000 – 52,000 by mid-2026; short-term pullbacks to ~44,000 possible, but upward bias remains. |
| Bull Case | Sharp easing in monetary policy, fiscal stimulus, strong GDP growth, global trade improves. | Could push DJIA above 55,000+, with accelerated gains in tech/industrial sectors. |
| Bear Case | Inflation re-accelerates, Fed forced to raise, earnings disappoint, global recession concerns. | DJIA may test ~40,000 – 42,000 or below in deeper stress scenarios; volatility spikes. |
Trading Strategies for DJIA
How to approach the index (for both swing/trend traders and longer-term investors).
Alerts & Signals
- Breakouts above resistance (~46,400-46,500) with strong volume as entry signals.
- Reversals or bearish divergences in RSI/MACD near overbought levels – caution.
- Watch for 50-day MA holds for pullbacks as buying zones.
Risk Management
- Always set stop-losses relative to volatility. For example, a drop below recent swing low (e.g. ~44,500) might be a warning.
- Use position sizing so that a single adverse move doesn’t degrade portfolio heavily.
- Use options for hedges (Puts or collars) when expecting possible sharp correction.
Instruments & Tools
- ETFs that track DJIA (e.g., DIA) or funds replicating the composition.
- Futures & CFDs for shorter-term leverage plays.
- Options: leverage and hedging; volatility strategies.
Frequently Asked Questions (FAQ)
Q: What affects the DJIA more – large tech stocks or industrials?
A: Though historically an “industrial” index, many of the highest-price stocks now are in tech. Thus, when high-price tech stocks move, they can disproportionately affect the index.
Q: How accurate are forecasts for DJIA?
A: Forecasts are probabilistic. A lot depends on macro inputs: inflation, Fed policy, earnings, global growth. Use scenario planning rather than fixed predictions.
Q: How volatile is the DJIA compared to the S&P 500 or Nasdaq?
A: Generally less volatile than the Nasdaq given fewer ultra-high growth stocks, but more volatile than some broad diversified indexes due to price weighting and concentration in some large names.
Q: Should I trade or invest in the DJIA?
A: Depends on your time horizon, risk tolerance. Long-term investors should focus on fundamental strength; short-term traders on technicals, macro data, and event risk.
Summary & Key Takeaways
- DJIA is near its 52-week high (~46,396), enjoying a strong uptrend through much of 2025.
- Although year-to-date returns are moderate (~7-9%), momentum is positive.
- Key resistance lies just above current levels, with solid support in the 44,000-45,000 range.
- Fundamental backdrop (inflation, Fed policy, earnings) will be decisive for whether gains continue or corrections occur.
- Diversified exposure, risk discipline, and watching leading stocks (especially high price weights) are crucial.


 XAUT-USD
  AMD
AMD  JNJ
JNJ  MARA
MARA  SHOP
SHOP  UNH
UNH  BULL
BULL  EURUSD=X
  CL=F
CL=F