
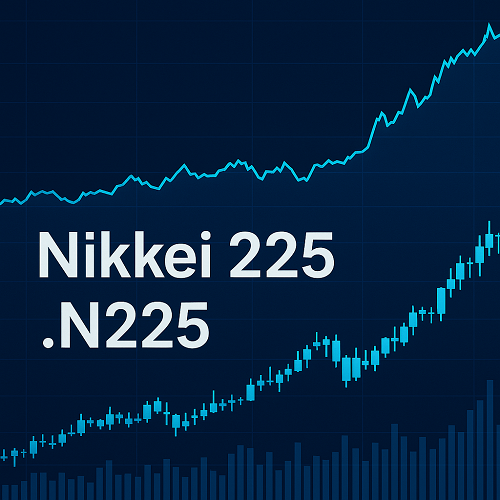
What Is the Nikkei 225 Index?
- The Nikkei 225, also known as the Nikkie Stock Average or simply “Nikkei”, is Japan’s premier stock market index, covering 225 of the largest, most liquid companies listed on the Tokyo Stock Exchange (TSE) Prime Market.
- It is price-weighted (not market-cap weighted), meaning that companies with higher share prices have disproportionately greater influence on the index’s movements.
- It serves as a barometer of Japanese equity market sentiment and is widely followed globally.
How the Nikkei 225 Is Calculated
- Price-Weighted Mechanism: Unlike many indices (e.g. TOPIX) that use market capitalization, the Nikkei’s methodology gives greater weight to companies with higher stock prices regardless of their size in terms of market cap.
- Component Reviews: The index’s components are reviewed twice a year (usually in April and October). Adjustments account for corporate actions (stock splits, mergers), liquidity, and sector representation.
- Adjustments for Corporate Actions: When a company in the index splits its stock or undergoes similar corporate changes, its weight is adjusted to maintain consistency.
Key Components & Sector Breakdown
- The 225 companies span sectors including Technology, Automotive, Financials, Consumer Goods, Industrials, and Utilities.
- Historically, Technology and Automotive (especially global exporters like semiconductor, electronics, and vehicle manufacturers) have been leading influences on Nikkei’s performance.
- Financials and exporters are sensitive to the strength or weakness of the yen.
Historical Performance & Major Turning Points
- Post-1960s growth: Japan’s rapid post-war expansion and technological industrialization fueled sustained growth in the Nikkei through the 1970s-1980s.
- 1989 bubble peak & crash: The index peaked near 39,000 in late 1989 before entering a decades-long bear market following real estate and credit bubbles.
- 2000s revival & global crisis: Recovery around early 2000s, followed by crashes (e.g. the 2008 global financial crisis), then partial recovery.
- 2010-2020s quantitative easing & Abenomics: Monetary stimulus, fiscal policy reforms, and yen depreciation often supported the Nikkei.
- Recent high: The index has been making all-time highs in 2025, breaking above key resistance levels around 45,000.
What Moves the Nikkei: Economic, Monetary & Geopolitical Drivers
| Driver | Mechanism | Example Impacts |
|---|---|---|
| Monetary policy (Bank of Japan & global rates) | Interest rates, QE/QT, Yield Curve control affect borrowing costs, currency moves, and equity valuations. BOJ decisions often lead to sharp market reactions. | If BOJ signals tightening (e.g. less support for bond yields, reduction of ETF/REIT purchases), yields rise, index may fall. Global rate cuts elsewhere help boost foreign demand for Japanese equities. |
| Currency (JPY strength or weakness) | A weaker yen — good for exporters (makes their products more competitive abroad); a stronger yen tends to hurt these firms. | Periods of yen depreciation often correspond with gains in Nikkei, especially for export heavy names. |
| Corporate earnings and sector-specific trends | Tech innovation, global demand for electronics, automotive cycles, and industrial equipment affect earnings. | For example, semiconductor shortages, EV demand, and supply chain shifts have recently boosted companies in electronics and auto. |
| Inflation & input costs | Rising energy, raw material, labor costs can squeeze margins. Also, inflation influences interest rate expectations. | High energy costs or disruption in supply chains weigh on production intensive sectors. |
| Global environment & trade dynamics | Trade policy, geopolitical tension, global economic slowdowns or booms. | Tensions with China, U.S. rate policy, global demand for automotive/electronics matter. |
Current Trends & Recent Behavior (as of mid-Sep 2025)
- The Nikkei 225 recently crossed 45,000 for the first time, a psychological and technical resistance level.
- The Bank of Japan (BOJ) has shown signs of leaning more hawkish: dissent in recent meetings, potential plans to sell holdings of ETFs and REITs.
- Inflation in Japan’s core remains above BOJ’s 2% target (≈2.7%), which complicates the central bank’s maneuver.
- Yen has slightly strengthened, bond yields are rising (10-year Japanese Government Bond yields near 1.63–1.64%), which is putting pressure on equities, especially exports.
Technical & Fundamental Analysis
Technical
- Resistance Levels: ~45,000 has been a recent resistance. Prior peaks around that level make it a crucial threshold.
- Support Zones: Around 44,000 to 44,500 formed in recent sessions; breakdown below could trigger retracement toward 43,000–42,500.
- Trend: Uptrend in place, with higher highs & higher lows. But momentum indicators (e.g. RSI, MACD) may show overbought conditions.
Fundamental
- Valuations: Given a price-weighted index, high-priced tech and export names drive valuations; some companies may look overvalued relative to earnings.
- Earnings Outlook: Positive for exporters if global demand holds; domestic demand weaker. Margin pressure from yen strength and input costs.
- Interest Rates & Policy Risk: Key risks lie in BOJ shifting policy too fast, global rates rising overall, or supply chain/inflation shocks.
Forecasts & What To Watch For
Potential Scenarios
| Scenario | Key Drivers | Possible Outcomes |
|---|---|---|
| Continued Uptrend | BOJ soft-landing of inflation, gradual tightening, yen weakens, global demand stays firm | Nikkei could breach new highs above 47,000-50,000, with export heavy names leading. |
| Stagnation / Pullback | Yen strengthens, BOJ tightens too fast, global slowdown, inflation spikes | Pullback toward 42,000-43,000; investors rotate out of export names into defensives. |
| Volatile Swing | Policy mixed signals, earnings surprises (positive or negative), global risk events | Sharp intraday swings; asymmetric risk (downsides magnified). |
Key Indicators to Monitor
- BOJ speeches, minutes, policy meeting outcomes
- JPY / USD (or USD/JPY) exchange rate moves
- Japanese inflation data, particularly core CPI
- Export orders and industrial production metrics
- Global indicators: U.S. / China growth, semiconductor demand, global shipping/climate disruptions
How to Trade or Invest in the Nikkei 225
- ETFs / Index Funds: Tracks Nikkei (e.g. Nikkei 225 ETF listed in Japan or global markets). Less risk, lower costs.
- Futures & Options: Nikkei futures let you leverage exposures, but higher risk.
- CFDs / Derivatives: For traders needing shorter-term exposure; need risk management.
- Direct Stock Picking: Focusing on components benefitting from export tailwinds, technology, autos.
Risks, Limitations, and Key Considerations
- Since the index is price-weighted, high-price stocks can distort exposure; performance may not represent overall Japanese economy or market breadth.
- Currency risk is significant: Even strong earnings can be offset if yen strengthens sharply.
- Policy risk: BOJ moves (interest rate / yield control) often come with volatility.
- Global risks: U.S. Fed policy, China slowdown, supply chain disruptions, geopolitical events all have outsized impacts.
11. FAQs
Q: How often are the constituents reviewed?
A: Twice per year (April and October), with adjustments for corporate actions, liquidity, and sector balance.
Q: What’s the difference between Nikkei 225 and TOPIX?
A: Nikkei is price-weighted; TOPIX is market-cap weighted. TOPIX includes all companies in the Prime Market, giving a broader market representation.
Q: How do currency changes affect the Nikkei?
A: A weaker JPY tends to help exporters (boost profits in foreign currency terms), enhancing Nikkei performance; a stronger JPY can hurt margins and thus weigh on the index.
Q: Is the Nikkei 225 a good investment now?
A: That depends on your risk tolerance. For investors optimistic on global demand, technological export growth, and moderate inflation, yes. But risks remain from overvaluation, policy shifts, and currency moves.
Conclusion
The Nikkei 225 (.N225) stands at a significant inflection point. As of mid-September 2025, the index has recently broken above 45,000, but faces risk from a hawkish tilt by the Bank of Japan, rising bond yields, and potential yen strength. For traders and investors, the key will be balancing exposure to export-led growth with awareness of macro, policy, and valuation risks.

 XAUT-USD
  AMD
AMD  JNJ
JNJ  MARA
MARA  SHOP
SHOP  UNH
UNH  BULL
BULL  EURUSD=X
  CL=F
CL=F