
The S&P 500 (Standard & Poor’s 500) is widely considered the benchmark for U.S. large-cap equities. It is a market capitalization-weighted index containing 500 of the largest publicly traded companies listed on U.S. stock exchanges. Together, these firms represent approximately 80% of the U.S. equity market capitalization.
Why it matters:
- It reflects the health of large-cap U.S. firms.
- Many investment products (ETFs, futures, mutual funds) track it.
- Used by investors globally as a standard performance measure.
History & Evolution of the S&P 500
- Origins: The roots of the S&P indices date back to the 1920s and 1930s. The modern S&P 500 was introduced in 1957 by Standard & Poor’s to provide a more accurate representation of the large-cap equity universe.
- Milestones:
- 1960s-70s: Introduction of additional classes (e.g., total return, geriatrics for dividends).
- 1980s-90s: Shift toward broader inclusion, improved data, introduction of sector classification (GICS).
- 2000s-2010s: Incorporation of technology giants, revising sector weights, adjusting methodology.
This evolution ensures the index remains relevant as markets change.
How Companies Are Chosen — Selection Criteria
To be included in the S&P 500, a company must satisfy several criteria:
- Market capitalization: Generally large, with a threshold that changes over time. (As of recent years, roughly US$14-15+ billion but subject to change.)
- Liquidity: Adequate trading volume, low bid‐ask spreads.
- ** domicile & listing**: U.S. companies, listed on major U.S. exchanges (NYSE, NASDAQ, etc.).
- Public float: A significant portion of shares must be publicly available.
- Financial viability: Positive earnings in recent quarters, generally.
- Sector balance: The committee attempts to maintain balanced representation among sectors.
Every quarter, S&P Dow Jones Indices reviews and may add or remove companies based on the methodology.
Calculation Methodology & Index Maintenance
- The S&P 500 is market-cap weighted: Larger companies have more influence.
- It uses a “free-float market cap” adjustment: only shares available to public investors (excluding closely held or restricted shares) count.
- Rebalancing: Companies are added/removed periodically. There is no fixed schedule like quarterly, but often done when needed (e.g. mergers, delistings).
- Dividends: The index calculation includes versions that account for dividends (total return index) and versions that do not.
- Methodological rules include handling of corporate actions (spin-offs, mergers, stock splits), share adjustments, etc.
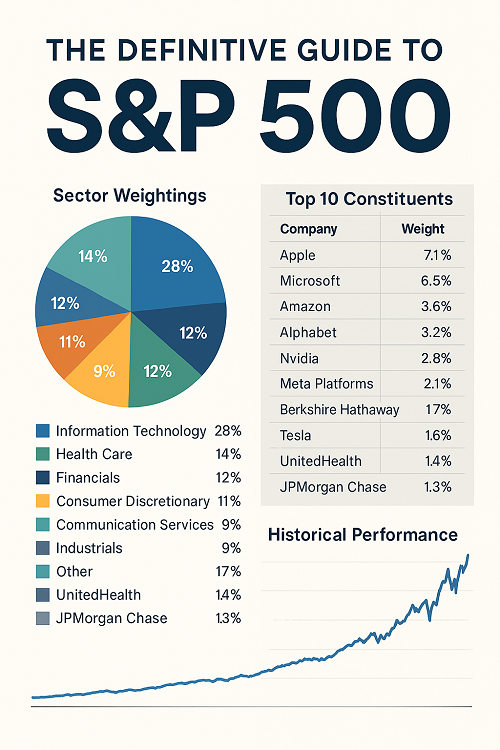
Sector & Industry Breakdown
The S&P 500 companies are grouped using the Global Industry Classification Standard (GICS) into 11 sectors. Typical sectors:
| Sector | Approximate Weight* |
|---|---|
| Information Technology | ~25-30% |
| Health Care | ~13-15% |
| Financials | ~10-12% |
| Consumer Discretionary | ~9-11% |
| Communication Services | ~7-9% |
| Industrials | ~7-9% |
| Consumer Staples | ~6-7% |
| Energy | ~3-4% |
| Utilities | ~2-3% |
| Real Estate | ~2-3% |
| Materials | ~2-3% |
*Weights fluctuate over time depending on constituent market caps and stock performance.
Also break-down by industry (e.g. software, semiconductors, pharmaceuticals) can offer more detail.
Top Constituents & Their Weightings
Because of its market cap weighting, a small number of the largest firms carry a disproportionately high influence. As of [most recent data]:
- Top 10 companies often include: Apple, Microsoft, Amazon, Alphabet (Google), Nvidia, Tesla, Meta Platforms, Berkshire Hathaway, UnitedHealth, JPMorgan Chase.
- Weightings: The top 10 can comprise 20-30% of the entire index depending on market conditions. Individual weights shift with stock price movements.
Understanding concentration risk is crucial: when a few companies dominate, they can drive overall index performance heavily.
Historical Performance: Returns, Volatility & Drawdowns
To understand risk & reward, it’s important to examine historical return metrics:
| Period | Annualized Return* | Max Drawdown* | Volatility (Std Dev)* |
|---|---|---|---|
| 1-year | ~— % | — % | — % |
| 5-year | ~— % | — % | — % |
| 10-year | ~— % | — % | — % |
| 20-year | ~— % | — % | — % |
| Since 1957 (or since first data) | ~7-10% (depending on dividends) | — % | — % |
*Exact numbers depend on whether total return (including dividends) is used vs price return.
Also noteworthy: in bear markets (e.g. 2000-2002, 2008, 2020), drawdowns can be −30% to −50%. Recovery periods vary. These metrics help investors set expectations.
S&P 500 vs Other Major U.S. Indices
To better understand its role:
| Index | General Characteristics | Key Differences vs S&P 500 |
|---|---|---|
| Dow Jones Industrial Average (DJIA) | 30 large blue-chip companies, price-weighted | S&P 500 is broader, market-cap weighted → more diversified and representative. |
| NASDAQ-100 | Heavy in technology / growth stocks | More concentrated; higher volatility; less balanced across sectors. |
| Russell 1000 / 2000 | Russell 1000 = large U.S. companies; Russell 2000 = small caps | S&P 500 captures large cap; Russell 2000 captures small-cap exposure. |
| MSCI USA / MSCI World | International exposure | S&P500 is U.S. only; MSCI World adds other developed markets; MSCI USA is broader small + mid + large. |
Comparisons help investors decide which indices better suit their risk tolerance and portfolio exposure goals.
Ways Investors Access the S&P 500
Investors can get exposure through:
- Index Funds & ETFs: Vanguard’s VOO, SPDR’s SPY, iShares IVV, etc.
- Mutual Funds: Funds designed to replicate index performance.
- Derivatives: Futures, options, total return swaps.
- Structured Products: ETNs, certificates.
Consider fees (expense ratios), tracking error, tax-efficiency, liquidity when choosing.
Limitations & Criticisms
While the S&P 500 is highly useful, it’s not perfect.
- Concentration Risk: Heavy weight in a few mega-caps means index can be skewed.
- Large-Cap Bias: Neglects mid & small cap growth potential.
- Sector Imbalance: Some sectors may get overrepresented (e.g. tech in certain cycles).
- Lack of international exposure: Not useful if you want global diversification.
- Valuation Issues: At times the index has overvaluation concerns (e.g. high P/E ratios).
- Survivorship Bias & Rebalancing Lag: When a company fails, removal often comes after damage is done; new entrants may not perform as much.
Variants of the S&P 500
There are several related versions:
- Total Return Index: includes reinvested dividends.
- Price Return Index: excludes dividends.
- Dividend Adjusted / Net of Withholding Tax: relevant for international investors.
- Currency Hedged Versions: mitigate foreign exchange risk.
- Sector-Focused / Equal-Weight Variants: e.g. S&P 500 Equal Weight, S&P 500 Top 50, S&P 500 Fossil Fuel Free, etc.
How to Track & Invest in It Wisely
Here are practical tips:
- Choose low-cost ETFs/funds to avoid drag from fees.
- Mind tax implications, especially for non-US investors with dividend withholding.
- Diversify outside S&P 500: small caps, international equity, bonds.
- Don’t overreact to short-term volatility — long-term view tends to smooth out.
- Rebalance periodically to maintain allocation targets.
Frequently Asked Questions (FAQs)
What is the difference between the S&P 500 price return and total return?
A: Price return reflects only changes in stock prices; total return also includes dividends reinvested, typically yielding higher long-term average returns.
How often are the components of the S&P 500 changed?
A: There’s no fixed schedule; changes happen as needed—due to mergers, bankruptcies, or to ensure the index meets criteria like sector representation and financial viability.
How large is the S&P 500 in market cap?
A: As of mid-2025, the combined market cap runs into many tens of trillions of USD, covering ~80% of US equity market cap.
How does weighting work?
A: Each constituent’s weighting is proportional to its free-float market cap, meaning larger companies have more influence on the index’s movement.
Can the S&P 500 be manipulated?
A: Because of transparent methodology and rigorous rules, manipulation risk is low, though large companies’ price moves can heavily influence index returns; also, “momentum” effects exist.
What is a good expected annual return?
A: Historically, including dividends, around 7-10% per year over long horizons (20-30+ years) for U.S. large-cap equities. Past returns are not guarantees of future performance.
Conclusion
The S&P 500 is more than just a collection of 500 stocks—it’s the benchmark for U.S. large-cap equities, a barometer of the health of the U.S. economy, and a key building block in many portfolios. Understanding its composition, methodology, performance history, and limitations allows investors to use it more intelligently—whether via ETFs, mutual funds, or derivatives. If you combine exposure to the S&P 500 with diversification (across sectors, geographies, and asset classes), keep fees low, and maintain a long-term mindset, you put yourself in a strong position for sustainable returns.
 XAUT-USD
  AMD
AMD  JNJ
JNJ  MARA
MARA  SHOP
SHOP  UNH
UNH  BULL
BULL  EURUSD=X
  CL=F
CL=F