
The Dow Jones Industrial Average (DJIA), often simply called “the Dow” or “the Dow Jones,” is one of the oldest, most watched equity indices in the world. It represents 30 large, publicly‐owned U.S. corporations, spanning key sectors (industrials, consumer discretionary, technology, healthcare, etc.).
- It serves as a barometer (indicator) of general U.S. stock‐market and economic health.
- Because it’s composed of selected large‐cap and blue‐chip stocks, it responds both to macroeconomic factors (rates, Fed policy, inflation, employment) and company‐specific events.
History & Evolution
| Period | Milestones / Key Changes |
|---|---|
| 1896 | Created by Charles Dow & Edward Jones; originally composed of 12 industrial companies. |
| Early 20th century | Added more companies, refined sectors; began to become benchmark for industrial (manufacturing) strength. |
| Mid‐1900s onwards | Broadened as U.S. economy diversified; more consumer, finance, tech exposure over time. |
| Recent years | Inclusion of tech giants (Apple, Microsoft), reflecting shift from “industrial” to more diversified economy. |
How the DJIA Is Calculated
- The DJIA is a price‐weighted index: each component’s weight is proportional to its stock price, not market cap.
- The Dow Divisor: adjusted over time for stock splits, dividends, company changes to maintain continuity.
- Because of price weighting, a higher‐priced stock can move the index more than a large market cap stock with a low price.
DJIA Components & Sector Weightings
Components
Some top names (as of late 2025) in the DJIA include:
- Apple (AAPL)
- Microsoft (MSFT)
- Nvidia (NVDA)
- Visa (V)
- Home Depot (HD)
- Procter & Gamble (PG)
- Chevron (CVX)
- Johnson & Johnson (JNJ)
- JPMorgan Chase (JPM)
- Walmart (WMT)
(There are 30 in total. Components change occasionally due to corporate actions or index committee decisions.)
Sector Exposures
- Technology & Consumer Discretionary have grown in influence even though “Industrial” remains the name.
- Financials, Healthcare, Consumer Staples are also meaningfully represented.
- Industrial sector’s share has diminished comparatively.
Key Performance Metrics
Some ways to evaluate the DJIA’s performance:
- YTD, 1-month, 6-month, 1-year returns
- Annualized returns over 3, 5, 10, 20+ years
- Volatility metrics: standard deviation, drawdowns
- P/E (price to earnings) ratio average of components (as a proxy)
- Dividend yield (from components)
Recent & Historical Trends
- Over 5 years to present (late 2025): the index has delivered ~50-70% gains (depending on start point) due to tech strength, monetary policy, post‐COVID recovery.
- Year-to-date movements reflect rate expectations, inflation data, earnings growth.
- Past decades show cycles: tech booms, financial crises, recoveries. Major inflection points around 2000, 2008, 2020.
Factors That Drive DJIA Movements
| Category | Key Drivers |
|---|---|
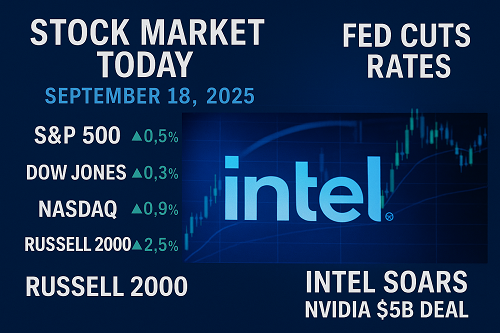
| Monetary policy / Interest Rates | Fed hikes or cuts, rate expectations, yield curve shifts. |
| Inflation & Macro Data | CPI / PCE inflation, employment, GDP growth/slowdown. |
| Corporate Earnings | Strong earnings from heavy weights (Apple, Microsoft, etc.) carry the index. |
| Sector Rotation | Shifts between growth / tech vs value / industrials / defensives. |
| Geopolitical / Global Events | Wars, trade policy, supply chain issues. |
| Regulatory / Fiscal Policy | Tax policy, regulation, stimulus. |
Technical Analysis: Patterns, Support & Resistance
To really trade the DJIA (or indices tied to it), understanding technical levels is essential.
- Support levels: previous bottoms, moving averages (50-, 200-day), Fibonacci retracement levels.
- Resistance levels: recent highs, trendlines, psychological round numbers.
- Common patterns: Ranges, Channels, Head & Shoulders, Double Bottoms/Tops, Rising & Falling Wedges.
- Moving average crossovers (e.g. 50-day crossing above 200-day = golden cross) often signal shift in trend.
Seasonal & Cyclical Behaviour
- “Sell in May and go away” is an observed phenomenon: summer months often see weaker returns.
- Election years tend to bring volatility.
- Quarterly earnings season can produce sharp moves in component stocks, which then ripple through the index.
- Cycle of leading sectors shifts: tech leads in bull, industrials/defensives lead during transitions or downturns.
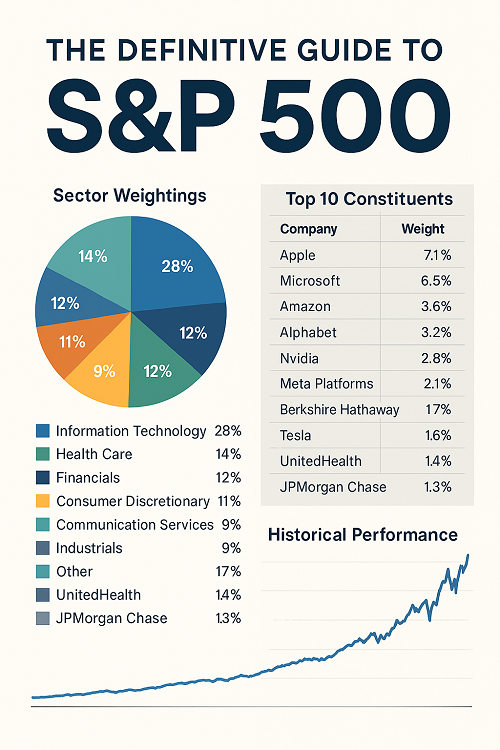
Comparative Indices: DJIA vs S&P 500 vs Nasdaq
| Feature | DJIA | S&P 500 | Nasdaq Composite / Nasdaq 100 |
|---|---|---|---|
| Number of stocks | 30 | 500 | ~3,000+ (Nasdaq Comp), 100 in Nasdaq‐100 |
| Weighting | Price‐weighted | Market cap weighted | Market cap |
| Sector bias | Historically industrials; more tech now but less diversified than S&P | More diversified across sector & company size | Heavily tech / growth oriented |
| Volatility | Generally lower than Nasdaq, possibly higher than S&P in certain environments | Moderate | Highest (due to tech/growth sensitivity) |
| Usage | Benchmarker, media reference | Broad market performance | Tech/growth behavior |
How to Trade or Invest in the DJIA
Investment methods
- Index Funds / ETFs: Funds that replicate DJIA (e.g. DIA).
- Individual Components: Buying the stocks making up the index.
- Futures & Options: DJIA futures for leverage / hedging.
Trading strategies
- Trend following: Using moving averages, breakouts.
- Mean reversion: Buying at support, selling at resistance.
- Swing trading and pullbacks: Using retracement levels, Fibonacci, RSI.
- Carry / dividend yield plays**: Less relevant since many DJIA comps are dividend payers but yield is lower when priced richly.
Risks, Limitations & Criticisms
- Price weighting flaw: High‐priced shares have disproportionate influence.
- Narrow scope: Only 30 companies → lacks small/mid cap exposure.
- Sector bias: If one sector is overrepresented, risk if that sector suffers.
- Corporate changes: Changes in components can distort continuity.
- Macro shocks: Sensitive to rate hikes, inflation, geopolitical risk.
Forecasts & Expert Views
- Short term (next 3-6 months): Expect volatility around Fed policy announcements, inflation data. Pullback possible if earnings disappoint or rate outlook worsens.
- Medium term (1-2 years): If inflation moderates and economic growth holds, likely modest gains; leadership may shift from growth/tech back toward value, industrials, financials.
- Long term: Historically, home country US index like DJIA tends to appreciate, but long‐term returns depend heavily on corporate earnings, innovation & productivity growth.
Frequently Asked Questions
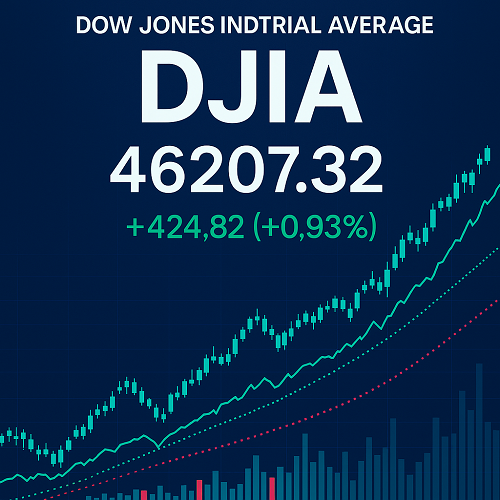
What is the current DJIA value?
It fluctuates minute by minute. You can find latest values via market data services or financial news platforms.
What was the highest DJIA ever?
As of latest data, the all‐time high was achieved on [recent date] around 46,300-46,500 USD (this will vary depending on data source).
What drives DJIA more: tech or industrials?
Increasingly tech (because of large cap/price of those stocks) but industrials still matter, especially during economic recoveries or infrastructure/climate policies.
Can I invest directly in the DJIA?
No. The index is a statistical measure. But you can invest via ETFs, funds, futures, or component stocks.
How reliable is DJIA as economic indicator?
It’s useful, especially for investor sentiment, but since it’s narrow (30 stocks), it can be misleading in some scenarios compared to broader indices like the S&P 500 or Russell 2000.

 XAUT-USD
  AMD
AMD  JNJ
JNJ  MARA
MARA  SHOP
SHOP  UNH
UNH  BULL
BULL  EURUSD=X
  CL=F
CL=F