Founded: April 1, 1976 (by Steve Jobs, Steve Wozniak, Ronald Wayne)
CEO: Timothy D. Cook
Employees: ~164,000 (FY latest)
Segments: iPhone; Mac; iPad; Wearables, Home & Accessories; Services (App Store, Apple Music, iCloud, etc.)
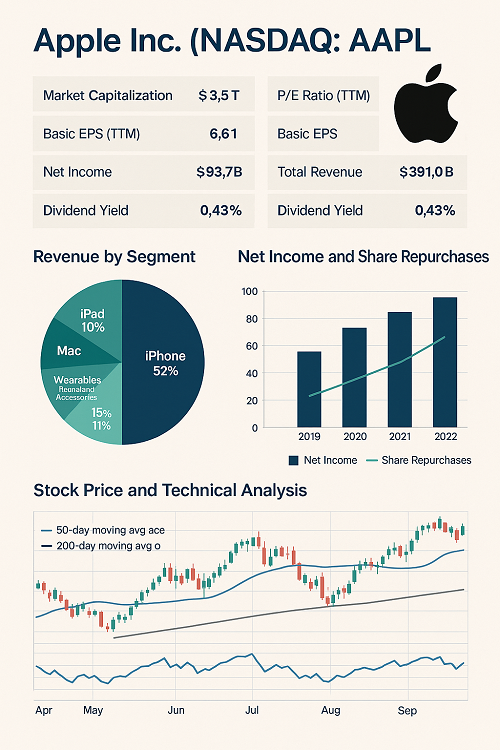
Key Stats (Latest)
Metric
Value
Market Capitalization
Over US$3.5 trillion
Price-to-Earnings Ratio (Trailing 12-months)
~36.5×
Basic Earnings Per Share (TTM)
~$6.61
Net Income (FY)
~$93.74 B
Total Revenue (FY)
~$391.04 B
Dividend Yield (Indicated)
~0.43 %
Beta (1-Year)
~1.15
Business Model & Revenue Drivers
Product Hardware vs Services
Hardware (iPhone, Mac, iPad, Wearables) remains the biggest chunk of revenue. iPhone annual sales are projected to continue growing, with forecasts for ~232 million units in FY2026—around a ~2% increase year-over-year.
Services (digital content stores, subscription based including Apple Music, iCloud, etc.) are higher margin and growing faster. Apple has focused heavily on recurring revenue streams.
Geographic Revenue Breakdown
Strong sales in Americas, Greater China, Europe, Japan, and rest of Asia-Pacific. Each region has its risks, especially China (trade policy, supply chain) and Europe (regulation, foreign exchange exposure).
Innovation & Ecosystem
New product launches (AR/VR, mixed reality, AI integration), continuously improving device capabilities.
Ecosystem lock-in: customers using multiple Apple devices and services (e.g., iCloud, Apple Watch, Mac + iPhone) increases retention.
Financial Performance & Deep Dive Metrics
Revenue Growth & Margins
YoY revenue growth has been solid, though pressure exists from global supply chain constraints, component costs, and currency fluctuations.
Gross margin tends to be in high-20s to low-30s percentages; operating margin is somewhat lower due to R&D, marketing, and service infrastructure.
Profitability Ratios
Operating Margin: healthy, especially in Services & Wearables given lower ongoing cost base.
Net Margin: reflective of tax rates, foreign income, debt servicing, and share buyback programs.
Cash Flow & Capital Allocation
Strong free cash flow generation; Apple regularly returns capital via dividends and share buybacks.
Balance sheet is robust, with significant cash + short-term investments; debt levels managed.
Recent Financials
Latest SEC filings (10-Q / 10-K) show steady revenue growth, especially in services.
Things to monitor: impact of product demand in China, impact of regulatory pressures in EU & US, and costs tied to R&D (AI, chips, etc.).
Competitive Landscape & Industry Trends
Major Competitors
Hardware: Samsung, Huawei, Xiaomi, Lenovo (for PCs), etc.
Services / Ecosystem: Google (Android & cloud), Microsoft (software & cloud), Amazon (streaming, cloud), Spotify, etc.
Key Industry Trends
AI & Machine Learning Integration: demand for smarter devices, voice assistants, on-device processing.
Chipmaking & Vertical Integration: Apple’s in-house silicon (M1, M2, etc.), potential for further edge.
Regulation & Privacy: increasing scrutiny in the US/EU regarding data / App Store policies.
Target recent resistance zone (e.g. previous highs), stop when below support + closes below MA
Swing / Medium-Term (Weeks to Months)
Trade earnings cycles or product launch windows
Enter ahead of major announcement; adjust for implied volatility if using options
Use trailing stop to capture upside; exit if guidance is weak or macros worsen
Long-Term (Months to Years)
Buy & hold growth + dividend + buybacks play; focus on services growth & pricing power
Accumulate on pullbacks; dollar cost averaging; focus when valuation is more attractive
Long-term risk: disruption, regulation; set re-assessment at major shifts (e.g. product flop, regulatory crack-down)
Options / Alternative Strategies
Covered calls if you’re long and want income in flat to mildly bullish environment.
LEAPS for long-term exposure with lower capital.
Using options around earnings: be careful with implied volatility crush.
Forecast & Analyst Expectations
Many analysts expect continued revenue growth from services & wearables, with hardware growth moderate.
EPS growth likely to be driven by margin expansion in services, cost management, and recurring revenue.
Price forecasts: ranges vary, but upside exists if Apple delivers on new product innovation and avoids major regulatory headwinds.
Conclusion & Investment Thesis
Apple Inc. is a mature giant with a unique combination of hardware scale and increasingly lucrative high-margin services. For investors, it offers a blend of steady cash flows, strong brand strength, recurring revenue, and growth potential via innovation. However, valuation is on the higher side, and risk from regulation, competition, and global macro conditions must be accounted for.
Bullish Case: Success in AI / AR devices, strong service growth, better margin control, favorable macro environment (stable rates, good consumer sentiment).
Bearish Case: Weakness in hardware margins, regulatory costs, slowing demand in key regions, currency headwinds.


 XAUT-USD
  AMD
AMD  JNJ
JNJ  MARA
MARA  SHOP
SHOP  UNH
UNH  BULL
BULL  EURUSD=X
  CL=F
CL=F