
What is the Shanghai Composite Index?
Definition & Composition
The Shanghai Composite Index (often tickered as SSEC in international services, or 000001.SS / SHCOMP) is the broad stock market index for the Shanghai Stock Exchange (SSE). It includes all listed A-shares and B-shares on the SSE — i.e. both domestic Chinese shares (A-shares) and foreign-investor accessible B-shares, though the bulk of activity is in A-shares.
It is a market-cap weighted composite index — every constituent influences the index by its market cap, so large companies carry more weight. The base date for the index is December 19, 1990.
Key Differences: A-shares vs B-shares; Large cap vs smaller
- A-shares are those traded in RMB on the mainland exchanges, historically restricted to domestic investors though gradually being opened via programs like Stock Connect. They tend to have higher liquidity and domestic policy sensitivity.
- B-shares are denominated in foreign currency, historically aimed at foreign investors, often less liquid and sensitive to external/global investor sentiment.
Within the index, you also see differences across sizes: large vs mid vs small-caps, with large and blue-chip stocks often responding more to foreign investment flows & macro factors, while smaller firms are more volatile and sensitive to domestic policy/regulation.
Comparison with Related Chinese Indexes
To correctly interpret what SSEC is telling you, compare it with other Chinese indices like:
- CSI 300 (top 300 stocks from Shanghai + Shenzhen): a blue-chip mix, often more followed by foreign investors.
- SSE 50 / SSE 180: indices for large cap / blue-chip stocks on SSE.
- STAR Market / STAR 50: focuses on tech / growth firms listed on the STAR board.
Each index has different sensitivities: SSEC is broad, so more noise; CSI 300 or SSE 50 often give a cleaner signal for market leadership & large-cap trends.
Historical Performance & Trend Overview up to 2025
Long-term Performance and Cycles
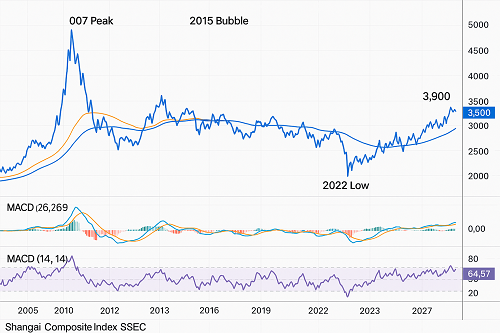
Over the past two decades, SSEC has gone through major cycles:
- The boom in the early 2000s
- Crash / correction in 2007–2008 (global financial crisis + domestic over-speculation)
- Sluggish growth in the 2010s, where regulatory tightening, property sector issues, corporate debt, and weak household consumption often held back performance.
- Recent years have shown increased volatility but with more frequent policy interventions, structural reforms, and shifts toward technology and consumption.
Recent Performance (2024–2025)
- As of late 2025, the SSEC is trading around 3,870 points.
- Year-over-year growth is approximately +40-plus %.
- 52-week range has been approximately 2,689.70 – 3,892.74.
- Recent trading shows resistance near the highs of the past year, and mild corrections / consolidations after rallies. Also, recent gains have been fuelled by optimism around policy stimulus, easing trade tensions, and domestic demand.
Volatility, Drawdowns & Recovery
- SSEC is volatile: some periods of steep drawdowns (e.g. policy crackdown, property sector stress) are followed by recoveries, aided by government stimulus or loosening policy.
- For example, gains have often come in spurts rather than smooth uptrends. Investors must expect seasonal weakness, sharp intraday swings, and rapid sentiment shifts.
- Comparing with global indices: Though returns have been strong lately, they are often more erratic; risk is nontrivial.
Fundamental Drivers of SSEC Moves
To understand where the Shanghai Composite is going, you need to know what moves it.
Macroeconomic Factors
- Economic Growth / GDP: Chinese growth rates, industrial output, PMI / manufacturing and services surveys, consumer spending all feed into investor expectations. Weak manufacturing or weak export orders can weigh heavily.
- Credit / Money Supply, Liquidity: The amount of stimulus, interest rates (both policy rates and lending rates), reserve ratios, banking sector credit availability matter. Tightening of these tends to hurt small/mid-caps.
- Property & Real Estate Sector: Due to the size of the Chinese property sector, stress in real estate (developers’ debt, falling prices) indirectly hurts financials, materials, and general market sentiment.
- Inflation & Input Costs: Because many listed firms import raw materials or rely on commodity inputs, inflation, supply chain constraints affect margins. Also, currency fluctuations matter.
Policy & Regulation
- Regulatory crackdowns (e.g. on tech, education, property) have historically caused sharp sell-offs.
- Incentives, subsidies, national priority programs (e.g. AI, semiconductors, green energy) can deliver out-size returns for certain sectors.
- Trade policy & foreign relations: Tariffs, export restrictions, US-China tensions, foreign capital access via Stock Connect all matter.
- Monetary / fiscal stimulus: tax cuts, subsidies, government bond issuance / fiscal spending, easing or tightening cycles from PBoC.
Foreign Investment & Capital Flows
- Programs like Shanghai-Hong Kong Stock Connect, foreign ownership quotas, and cross-listing affect how much foreign capital can flow into SSEC constituents.
- FX policy, capital controls, risk of regulation changing (e.g. delisting risk or foreign access restriction) weigh on foreign participation.
- Sentiment globally (how investors view China vs emerging markets) can shift flows quickly.
Sectoral Trends
- Technology / AI / semiconductor stocks are among top drivers of upside in current cycle. Growth and expectations in those sectors are feeding into broader indices.
- Industrials, materials, energy respond to Chinese infrastructure plans, export demand, commodity cycles.
- Real estate / finance are more regulated by policy and often act as bellwethers for systemic risk.
- Consumer discretionary: domestic consumption, urbanization, household incomes.
Technical Analysis & Trader Signals
For traders and short‐term investors, the technical setup of SSEC offers both opportunity and warning signs.
Support / Resistance Zones
- Support is seen around prior consolidation bottoms—often near 3,200-3,500 zones, especially in times of pullbacks.
- Resistance around the recent highs (~3,880-3,900), which appears to act as psychological and technical barrier.
- Also, moving averages (50-, 100-, 200-day) often act as dynamic support/resistance. Traders watch whether the index holds above its 200-day MA.
Key Indicators: MACD, RSI etc.
- Current RSI (14-day) is neither overbought nor deeply oversold, in many technical reports showing a “neutral to modestly bullish” tilt.
- MACD crossovers could signal trend shifts; monitoring divergences (price making new highs but indicator not) helps spot potential weakening.
- Trend strength indicators (AD‐X, volume trends) are important: strong price moves without volume tend to be less reliable.
Chart Patterns, Elliott Wave, Trend Cycles
- Some analysts see an Elliott Wave structure (e.g. ongoing Wave 3 of a larger impulsive move) suggesting the potential for further upside, but also the risk of corrections ahead.
- Breakout above resistance could trigger acceleration; failure to break and a drop could indicate consolidation or even a pullback.
- Watch for pattern formations: double tops, head & shoulders, channel tops/bottoms, etc.
Scenarios: Breakout / Breakdown
- Bullish breakout: Close decisively above ~3,900 with strong volume could open path to 4,200-4,500 (assuming favorable macro / policy).
- Bearish breakdown: Falling below sustained support (say ~3,200-3,400) could signal deeper correction; traders would look to moving averages and prior lows in that case.
Trading & Investment Strategies Around SSEC
Investment vs Speculation: Timeframes
- If you’re investing for 1-5 years or more, look for sectors likely to benefit from China’s long-term priorities (AI, semiconductors, clean energy, domestic consumption).
- Short‐term speculative plays may involve earnings surprises, policy announcements, or global risk events. Great care with leverage, since China’s markets can swing sharply on news.
Getting Exposure
Options to play SSEC include:
- ETFs / Index funds focusing on Shanghai-listed A-shares or broader Chinese equity exposure.
- Chinese ADRs / cross-listed securities, though they don’t track SSEC exactly.
- Stock Connect programs for foreign investors to directly own A-shares via Hong Kong connection.
- CFDs or futures for traders seeking short-term exposure (beware of rollover costs, margin risk).
Hedging & Managing Risk
- Currency risk: Even if you own Chinese equities, fluctuations in CNY can affect returns for foreign investors.
- Policy risk: Be prepared for abrupt policy changes; use options or protective puts, or limit exposure in more sensitive sectors (e.g. education, property).
- Diversification: Within China, diversify across sectors; also consider global or emerging market exposure to manage systemic risk.
Position Sizing & Capital Management
- Given volatility, avoid over-leveraging.
- Use stop losses, or at least clearly defined exit points.
- Keep part of capital dry to deploy during corrections.
- Be mindful of trading costs, regulatory/trading deadlines, taxes (especially for foreigners).
Key Risks & What To Monitor
To avoid surprises, keep watch on:
Regulatory & Policy Uncertainty
- China’s regulatory environment can shift fast — clampdowns (education, internet, real estate), or loosening.
- Laws/regulations affecting foreign investors (listing rules, disclosure, cross-border data, foreign ownership caps).
Economic Slowdowns / Debt & Property Sector Issues
- Real estate remains a heavy risk: developer debt, falling prices, possible defaults.
- Corporate debt and local government debt: hidden liabilities could sometimes leak into financial sector stress.
Currency & Capital Controls
- RMB exchange rate and policies governing capital flow in/out readily affect sentiment.
- Uncertainty over foreign exchange restrictions or required approvals can deter foreign capital.
Global Headwinds
- Trade tensions, supply chain disruptions.
- Global interest rate environment: if Fed or other major central banks raise rates aggressively, differentials matter.
- Global investor sentiment; risk aversion tends to hit emerging markets significantly, including China.
What’s Ahead: Forecasts & Possible Scenarios
Here are possible outlooks for SSEC in the next 12-24 months, depending on key variables.
| Scenario | Key Drivers | Expected Outcome / Range |
|---|---|---|
| Base Case | Moderate growth in China (~4-5% GDP), steady policy support, modest inflation, stable foreign investment | SSEC could grind higher to ~4,200-4,500 if resistance breaks, or move in range 3,800-4,200 with pullbacks to ~3,500 on weak data. |
| Bull Case | Big tech / AI breakthroughs, favorable trade deals, surge in foreign inflows, strong consumer spending | Possible targets in 4,500-5,000+, perhaps erasing more of the deficit since prior peaks; sectoral outperformance, tech leading. |
| Bear Case | Regulatory shocks, property sector collapse, weak global demand, currency weakness, geopolitical shocks | Might see a drop toward ~3,000-3,200 or below, with volatile swings. Investor caution, capital outflows, market declines. |
FAQs — Quick Answers
| Question | Answer |
|---|---|
| Is SSEC a good “China economy” barometer? | Yes and no. It reflects China’s listed domestic businesses on the SSE; however, it is biased toward certain sectors (finance, industrials, large state-owned firms), so for consumer/A-share tech exposure you might also consider CSI 300 or STAR board indices. |
| How does one buy into it? | Via ETFs, mutual funds, or directly via China A-share access (Stock Connect), or via ADRs/funds that replicate Chinese equities. |
| How risky is SSEC vs other indices? | Generally more volatile, more subject to domestic policy/regulation, and less accessible globally in terms of transparency/licensing. But with higher risk comes opportunity. |
| How do global events affect SSEC? | Trade tensions, US interest rates, global demand for exports, commodity prices, and global liquidity cycles have outsized effects. Also, currency risk for foreign investors. |
| Does “SSEC” include all shares on Shanghai? | Generally yes—both A and B shares on SSE. But different indices (SSE 50, SSE 180, CSI) include subsets, so depending on your exposure you may want to look at those. |
Summary & Key Takeaways
- Shanghai Composite (SSEC / SSE Composite) is China’s broadest index of Mainland listed stocks — valuable for understanding China’s domestic market and policy-driven shifts.
- It has shown strong gains recently (2024-2025), yet stands near resistance; volatility remains high.
- Fundamental drivers — policy, foreign flow, macro stability, sector leadership — matter more than just momentum.
- For traders: watch breaking above resistance near 3,900 and holding supports near 3,200-3,500; manage risk tightly.
- For investors: long term growth likely tied to how quickly China transitions toward consumption, tech, domestic innovation, and how it manages debt/property and maintains policy stability.
 XAUT-USD
  AMD
AMD  JNJ
JNJ  MARA
MARA  SHOP
SHOP  UNH
UNH  BULL
BULL  EURUSD=X
  CL=F
CL=F