
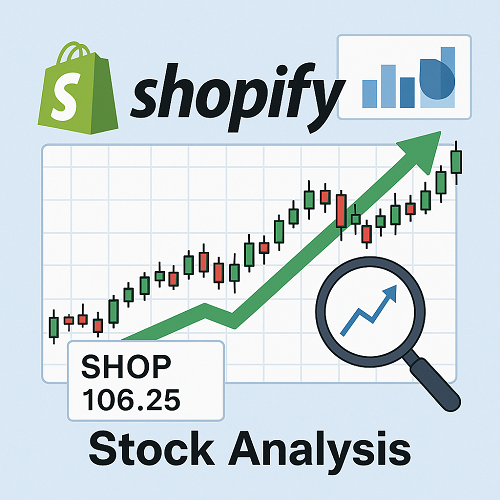

Shopify Inc. (NASDAQ: SHOP), the Canadian-born e‑commerce titan headquartered in Ottawa, offers a powerful all-in-one platform for businesses—commerce, payments, inventory, shipping, and marketing—all fueled by expanding AI capabilities. For investors looking at the Shopify stock chart, it is currently trading near USD 106, poised at a crossroads between short-term volatility and long-term expansion.
 Shopify Inc.
Latest Market Performance & Technical Outlook
- Recent trend: In mid-June 2025, SHOP cleared a key buy point (~$112) during a cup‑with‑handle breakout, but reversed amid tariff headlines. Investors should watch the Shopify stock chart closely for indicators.
- IBD metrics: Composite rating high (~97–98), Accumulation/Distribution B to B−—indicating institutional accumulation that can be seen in the Shopify stock chart analysis.
- Chart levels: Watch for support at ~$105 (21‑day EMA), resistance again near $112–118 buy zone as shown in the Shopify stock chart information.
Fundamental Growth Momentum
- Revenue growth: +27% YoY in Q1 2025; consistent ~26% average growth over 8 quarters. Q2 guidance ~24%, then decelerating to ~19% thereafter.
- Profitability: EPS growth decelerated to +25% in Q1—moderating but still robust. Gross margins improving due to AI integration and cost controls.
- Valuation: Trading at ~73× forward P/E, versus Amazon at ~36×—premium driven by growth story. Tracking a Shopify stock chart could help predict future valuation movements.
Analyst Sentiment & Price Targets
| Firm | Date | Rating | Target ($) | Upside (%) |
|---|---|---|---|---|
| UBS | May 9 | Hold | 110 | +4 |
| Cantor Fitzgerald | Jun 11 | Hold | 91 | –14 |
| Wells Fargo | Jun 6 | Buy | 125 | +19 |
| JPMorgan | May 9 | Buy | 115 | +9 |
| Barclays | May 9 | Hold | 94 | –11 |
- Consensus: Strong buy-to-moderate buy on MarketBeat; most targets centered around $120. Analysts see upside near +15% base case. Observing the Shopify stock chart can provide further insights.
Competitive Landscape & Positioning
- Peers: Competes with enterprise software giants (Snowflake, Veeva, Verisign), but stands out with zero dividend and higher growth profile.
- Strengths: Largest e‑commerce ecosystems, powerful app store (16,000+ apps), AI-enhanced tools, and global merchant base ($292B GMV in 2024).
- Risks: Valuation premium demands growth; macro headwinds like tariffs and Fed rate uncertainty weigh in. Monitoring the Shopify stock chart could indicate how these risks are perceived.
Future Forecasts & Scenarios
- Short-Term: Neural net forecasts project ~$107–$117 June average; modest pullbacks possible before breakout. Utilization of a Shopify stock chart helps in understanding projected short-term movements.
- Year-End 2025: Analysts range $120–151; median ~$130—supported by continued 20–25% revenue growth and margin improvement.
- Long-Term (2030+): Bull cases forecast $364 by 2040 and over $500 by 2050 based on sustained expansion. Keep an eye on long-term trends reflected in the Shopify stock chart data.
Risks & What to Monitor
- Macro: Potential new tariffs and trade tensions; Fed rate direction. The Shopify stock chart might reflect the impacts of these macro risks.
- Execution: Maintaining margins amid AI ramp-up and capping customer acquisition costs.
- Competition: Big-tech encroachment (Amazon, Shopify Plus vs. Salesforce/Adobe).
- Investor Sentiment: Elevated valuation; failure to meet growth expectations could trigger sharp corrections.
Strategic Trade & Positioning Tips
- Tactical Entry: Buy on dips near $105; scale into breakout above $112–118.
- Long-Term Holding: Strong fundamentals support a buy-and-hold strategy targeting a 3‑5 year horizon.
- Risk Management: Use 8–10% stop-loss; consider hedges (e.g., QQQ put options or modest short in consumer discretionary ETFs against tariffs). Analysis through a Shopify stock chart could support effective risk management.
Conclusion & Outlook
Shopify remains a premium growth stock with substantial upside potential backed by strong fundamentals, AI integration, and global market traction. While short-term volatility remains a factor, the medium-to-long-term thesis remains intact, making it a compelling candidate for investors seeking exposure to e‑commerce innovation. Tracking the Shopify stock chart will be crucial for investors.
Final Take
Investors should weigh short-term pullback risks against Shopify’s compelling long-term narrative. With continued execution, AI enhancements, and global expansion, Shopify offers a differentiated growth portfolio—deserving close monitoring and selective accumulation on dips.

 XAUT-USD
  AMD
AMD  JNJ
JNJ  MARA
MARA  UNH
UNH  BULL
BULL  EURUSD=X
  CL=F
CL=F