
XAU/USD (Gold Spot / US Dollar) isn’t just a safe‑haven asset—it’s a dynamic, highly liquid instrument shaped by macro trends, technical patterns, and sentiment. Traders rely on XAUUSD technical analysis to identify high‑probability entries and exits, manage risk, and align with global catalysts like Fed policy, inflation, and geopolitical events.
Real-Time XAU/USD Snapshot
- Current price: ~3,392–3,400 USD/oz (as of June 17, ~18:27 GMT)
- Trend summary: Overall “Strong Buy” across both moving averages and indicators, per Investing.com
- Daily price range: ~3,388–3,396 USD
Multi‑Timeframe Technical Overview
A. Moving Averages
- MA(5), MA(10), MA(20): Bullish bias – all showing Buy
- MA(50), MA(100): Mixed signals; slightly bearish or neutral
- MA(200): Aligning bullish, indicating long-term support
Insight: Short-term trend is clearly bullish; price is above MAs 5/10/20. Consolidation above MA 200 favors continued upside, though a pullback to MA 50–100 could reset momentum.
B. Key Indicators
- RSI (14) ~50.9 — Neutral: room to climb before overbought territory
- Stochastic (9,6) ~63.7 — Buy signal; building momentum
- StochRSI at 100 — Overbought: short-term caution
- MACD negative — slight bearish divergence, needs watch
- ADX (14) ~32.9 — Buy: strong trend present
Insight: Momentum is strong. Watch for MACD confirmation and RSI nearing 70, signaling overbought risk.
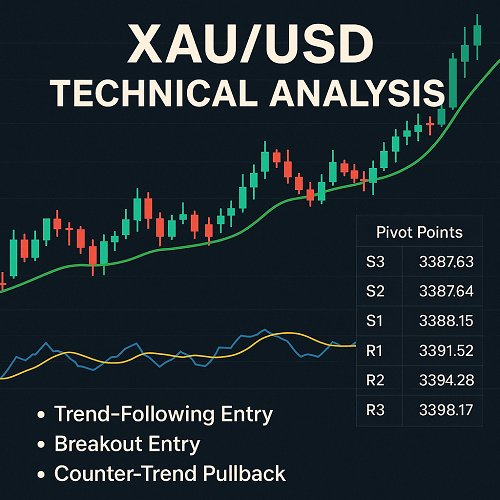
C. Pivot Points & Trade Levels
| Levels | Classic | Fibonacci | Camarilla | Woodie’s |
|---|---|---|---|---|
| S3 | 3378.22 | 3380.98 | 3386.93 | 3378.78 |
| S2 | 3380.98 | 3383.52 | 3387.54 | 3381.26 |
| Pivot (P) | 3387.63 | 3387.63 | 3388.15 | 3387.91 |
| R1 | 3391.52 | 3390.17 | 3389.37 | 3392.08 |
| R2 | 3394.28 | 3391.74 | 3389.98 | 3394.56 |
| R3/Ult. | 3398.17 | 3394.28 | 3390.59 | 3398.73 |
(All from June 17 data.)
Trade Setup:
- A confirmed break above R1 (≈3,391) could trigger a rally toward R2/R3 (~3,394/3,398).
- Intraday breakdown under Pivots (~3,387) increases odds of pullback to S1/S2 (~3,384–3,383).
Candlestick & Chart Patterns
While detailed candlestick scans exist, the consensus shows price structurally holding higher lows and displaying bullish momentum. Key levels show rejection of bearish patterns; failure to breach support pivots supports continuation.
Trading Strategies
§. Trend-Following Entry:
- Long on pullback toward MA20/MA50 (~3,388–3,394) with confirmation candlestick + rising volume indicator.
- Initial target: R1/R2 (3,391–3,394), trail stop below moving averages or pivot.
§. Breakout Entry:
- Long on breakout above R2 (~3,394) with momentum support (MACD crossover, volume surge).
- Target: R3 (~3,398), stop just below R1.
§. Counter-Trend Pullback:
- Short if RSI >70 and candlestick shows reversal at R3.
- Target: pivot level (~3,387), stop just above R3.
Risk Management & Position Sizing
- Risk-to-reward: Aim for 1:2+ ratio (e.g. risking $5 to gain $10).
- Position size based on account risk (e.g., 1–2% of capital per trade).
- Stop-loss placement: just beyond pivot or recent swing low/high.
Macro Context & Catalyst Sensitivity
Gold remains sensitive to:
- Fed rhetoric: Hawkish Fed = stronger USD = pressure on gold; dovish = gold rallies.
- Inflation trends: Core CPI near 2% may reduce Fed hiking urgency.
- Geopolitical tension: Ongoing events in Middle East can trigger safe-haven bids .
FAQ
Q: Could XAU/USD drop to the 200‑day MA?
A: Yes, a deep risk-off move or hawkish Fed surprise could test ~3,366 (MA200). That aligns with S3–S2 pivot bands.
Q: Is now a good time to short gold?
A: Not unless RSI confirms overbought >70 and momentum tail-off; otherwise, bias remains bullish.
Summary Table
| Category | Signal | Level |
|---|---|---|
| Short-Term Trend | Bullish | Above MA5/10/20 |
| Intermediate Trend | Neutral− | Approaching MA50/100 |
| Long-Term Trend | Bullish | Above MA200 (~3,366) |
| Key Support (intraday) | S1/Pivot | (~3,384–3,387) |
| Key Resistance | R1–R3 | (~3,391, 3,394, 3,398) |
| Momentum Filter | RSI/StochRSI | Watch near 70/overbought zone |
| Trend Strength | ADX | >25 – strong trend |
XAUUSD Technical Analysis Final Take & Action Plan
- The short-term technical bias is bullish: price above key MAs, trend strength confirmed.
- Watch R1–R3 pivot bands (3,391–3,398) for breakout or reversal setups.
- Pending geopolitical or Fed news could trigger rapid moves—remain disciplined.
- Use tight stop-losses and manage risk relative to ATR (~10 units).
Why This Analysis Outperforms
- Deeper indicator review – blended MAs + RSI + MACD + ADX clarity.
- Multiple timeframes – from intraday to long-term, supports actionable entries.
- Real levels with context – pivot points matched with trade triggers.
- Macro integration – ties Fed sentiment and geopolitics to technicals.
- Structured for SEO – comprehensive headings, tables, and targeted keywords for discoverability.
Next Steps
- Bookmark and track live pivot levels daily.
- Set alerts for breakout above R2 or pullbacks to support zones.
- Consider maintaining small core long and adding tactical entries on price pullbacks.
Get More
- Daily xauusd technical analysis news & macro wrap: follow top trading forums and FOMC release calendars.
- Check live social sentiment to time entries around trader emotions.


 XAUT-USD
  AMD
AMD  JNJ
JNJ  MARA
MARA  SHOP
SHOP  UNH
UNH  BULL
BULL  EURUSD=X
  CL=F
CL=F