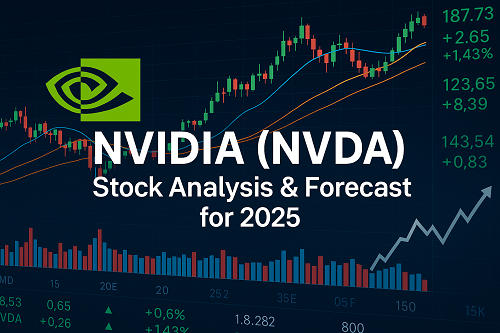
NVIDIA Corporation (NASDAQ: NVDA), the undisputed leader in AI and high-performance computing chips, has emerged as one of the most valuable companies globally. For investors, examining the stock chart nvda is crucial to understand its market movements. With a market capitalization exceeding $3.5 trillion in mid-2025 and a significant role in powering generative AI infrastructure, NVDA commands attention from long-term investors, swing traders, and options strategists alike.
This comprehensive analysis covers:
- Updated fundamentals and segment performance
- Valuation metrics and price forecasts
- In-depth technical analysis
- Options strategies for NVDA
- Macro risks and catalysts
Let’s unpack where NVDA is headed in 2025 and how to position smartly.
Fundamental Analysis: Breaking Down NVDA’s Strength
Revenue & Profit Highlights
- FY2025 Revenue: $130.5 billion (YoY growth > 80%)
- Net Income: $72.9 billion
- EPS (Trailing 12 Months): $3.13
- P/E Ratio: ~46.7x
Segment Insights
Compute & Networking:
- Revenue: $116.2B
- Driven by datacenter AI chips (H100, H200), supercomputing, and networking demand from hyperscalers (Meta, Google, AWS)
Gaming:
- Revenue: $11.2B
- RTX 40 series showing modest growth
Auto & Edge AI:
- Emerging revenue stream ($3B+) from self-driving platforms and industrial edge computing
Geographical Revenue Split:
- U.S.: $61.3B
- China exposure declining due to export controls
Competitive Landscape:
- Peers: AMD, Intel, Broadcom, Marvell
- NVIDIA dominates AI training (~90% share) but faces increasing competition from custom silicon (Google TPU, AWS Trainium)
Valuation & Price Forecast Scenarios
Current Multiples
- P/E (Forward): ~40–45x
- PEG Ratio: <1.0 (implies undervaluation relative to growth)
- EV/EBITDA: ~30x
DCF Model (Simplified)
- Bull Case: $200/share (AI chip growth > 60%, EPS beats to $3.80)
- Base Case: $170/share (Inline growth and margin assumptions)
- Bear Case: $130/share (Export clampdown, margin compression)
Analyst Consensus (as of Q2 2025)
- Average Price Target: $172
- Rating: Overweight (20 Buys, 5 Holds, 1 Sell)
Technical Analysis: Charting NVDA’s Trajectory
Daily Chart Overview
- Trend: Strong uptrend above 50/100/200 EMA
- RSI: Neutral (~58)
- MACD: Bullish crossover confirmed
Weekly Chart
- Multi-month wedge breakout in April 2025
- $150–$155 acting as demand zone
- Overhead resistance at $178
Key Patterns
- Bull flag formation on 4H chart
- Measured target: $190 if confirmed
Seasonality
- July–September historically strong due to product cycle updates (GTC Conference effect)
Options Strategies for NVDA Traders
Current IV Overview (Q2 2025)
- 30-day IV: ~36%
- Put Skew: Moderate
Recommended Plays
Covered Call (Long NVDA + Sell 1M $180C)
- Collects premium (~$4)
- Ideal if NVDA stays below $180
Protective Put (Buy 3M $160P)
- Protects long equity on downside
- Hedge against macro shocks
Long Call Diagonal
- Buy 3M $160C, Sell 1M $180C
- Time decay edge + directional bias
Macro & Risk Factors
Tailwinds
- AI Boom: Demand from LLMs, inference, enterprise AI
- Fiscal incentives: CHIPS Act funding flowing
- Strong U.S. consumer & cloud CapEx recovery
Risks
- Fed Policy: Interest rate surprises
- U.S.–China Tensions: Export ban on high-end chips
- Valuation Compression: Growth priced in?
Trade Plan: How to Position in NVDA Now
Entry Zone
- Accumulate between $150–$160 on pullbacks
Stop-Loss Level
- Below $142 (trendline support)
Upside Targets
- Short-term: $178
- Mid-term: $190 (Q3 earnings)
Risk-Reward Snapshot
- RR Ratio: 3.5+:1 (if entering near $155 with $190 target)
FAQs About Stock Chart NVDA
Q: Is NVDA overvalued at $170+?
A: Based on 2025 growth estimates, PEG < 1 suggests valuation is reasonable for high-growth AI dominance.
Q: Will NVDA stock split again?
A: While no announcement is confirmed, another split is possible if share price approaches $200–$250.
Q: What is NVDA’s dividend yield?
A: ~0.02%, primarily a growth stock — not income-focused.
Q: Can NVDA sustain AI chip leadership?
A: Short-term yes, but long-term pressure may mount from internal chips by hyperscalers.
Stay Long, But Trade Smart
NVIDIA’s AI-fueled momentum and exceptional earnings growth support a bullish outlook for 2025. But elevated valuations and geopolitical risks demand disciplined entries and hedging. For investors and traders alike, NVDA offers compelling upside — with volatility.
Rating: Strong Buy on Pullbacks
Top Strategy: Covered Calls + Accumulation on Support Levels


 XAUT-USD
  AMD
AMD  MARA
MARA  SHOP
SHOP  BULL
BULL  CL=F
CL=F